Fig. 6
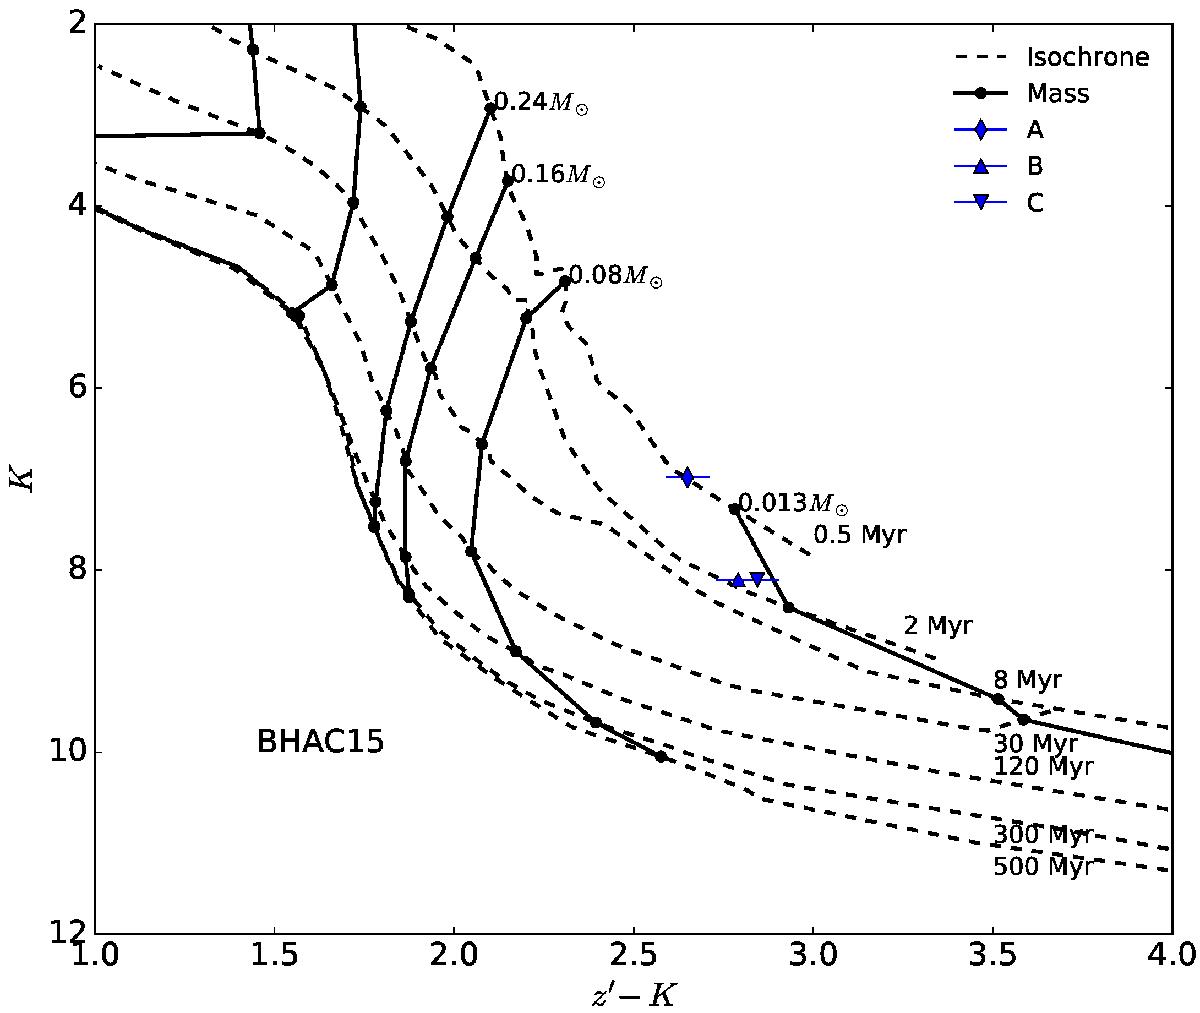
Baraffe et al. (2015) stellar evolutionary models with isochrones ranging from 0.5 Myr to 500 Myr plotted with z′ and K absolute magnitudes. The observed data of J1036 is depicted by the blue diamond and triangles for the A, B, and C components, where we have used the 20.1 pc distance from Shkolnik et al. (2012). Similar to Fig. 5, the models do not agree with the individual dynamical mass of 0.24 M⊙ for the B and C components. The models also suggest a very young age unless the distance to the system has been overestimated.
Current usage metrics show cumulative count of Article Views (full-text article views including HTML views, PDF and ePub downloads, according to the available data) and Abstracts Views on Vision4Press platform.
Data correspond to usage on the plateform after 2015. The current usage metrics is available 48-96 hours after online publication and is updated daily on week days.
Initial download of the metrics may take a while.