Fig. 4
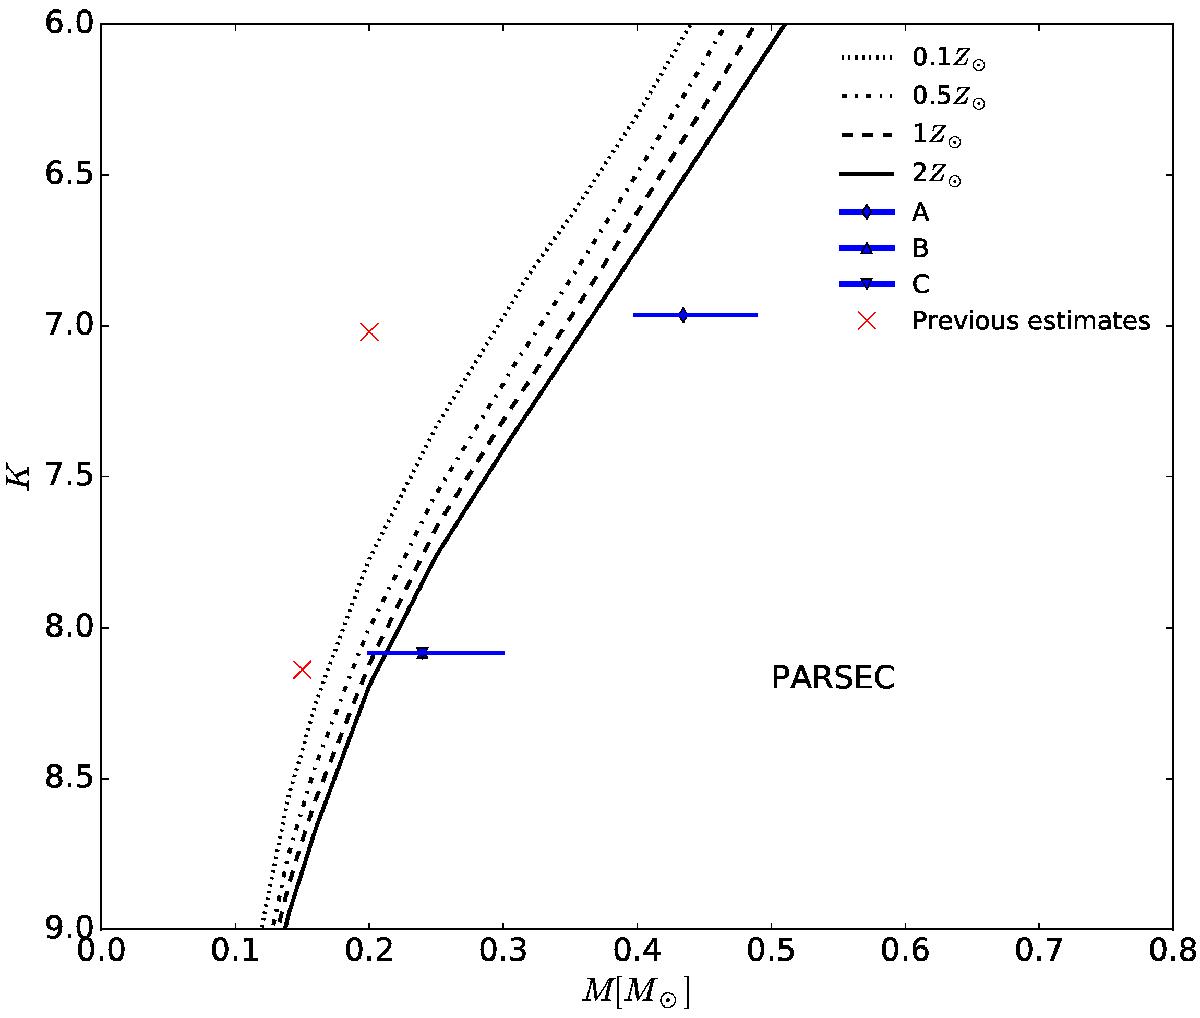
Evolutionary tracks of Bressan et al. (2012) with four tracks for different metallicities for the 500 Myr isochrone. Our dynamical mass estimates are depicted by the blue triangular and diamond markers and the earlier photometric estimates from Daemgen et al. (2007) by the red crosses (the arm length does not represent an error estimate for the cross). Solar metallicity is shown by the dashed line and the average metallicity of the Ursa-Major moving group is somewhere between the dashed-dotted and the solid line.
Current usage metrics show cumulative count of Article Views (full-text article views including HTML views, PDF and ePub downloads, according to the available data) and Abstracts Views on Vision4Press platform.
Data correspond to usage on the plateform after 2015. The current usage metrics is available 48-96 hours after online publication and is updated daily on week days.
Initial download of the metrics may take a while.