Fig. 3
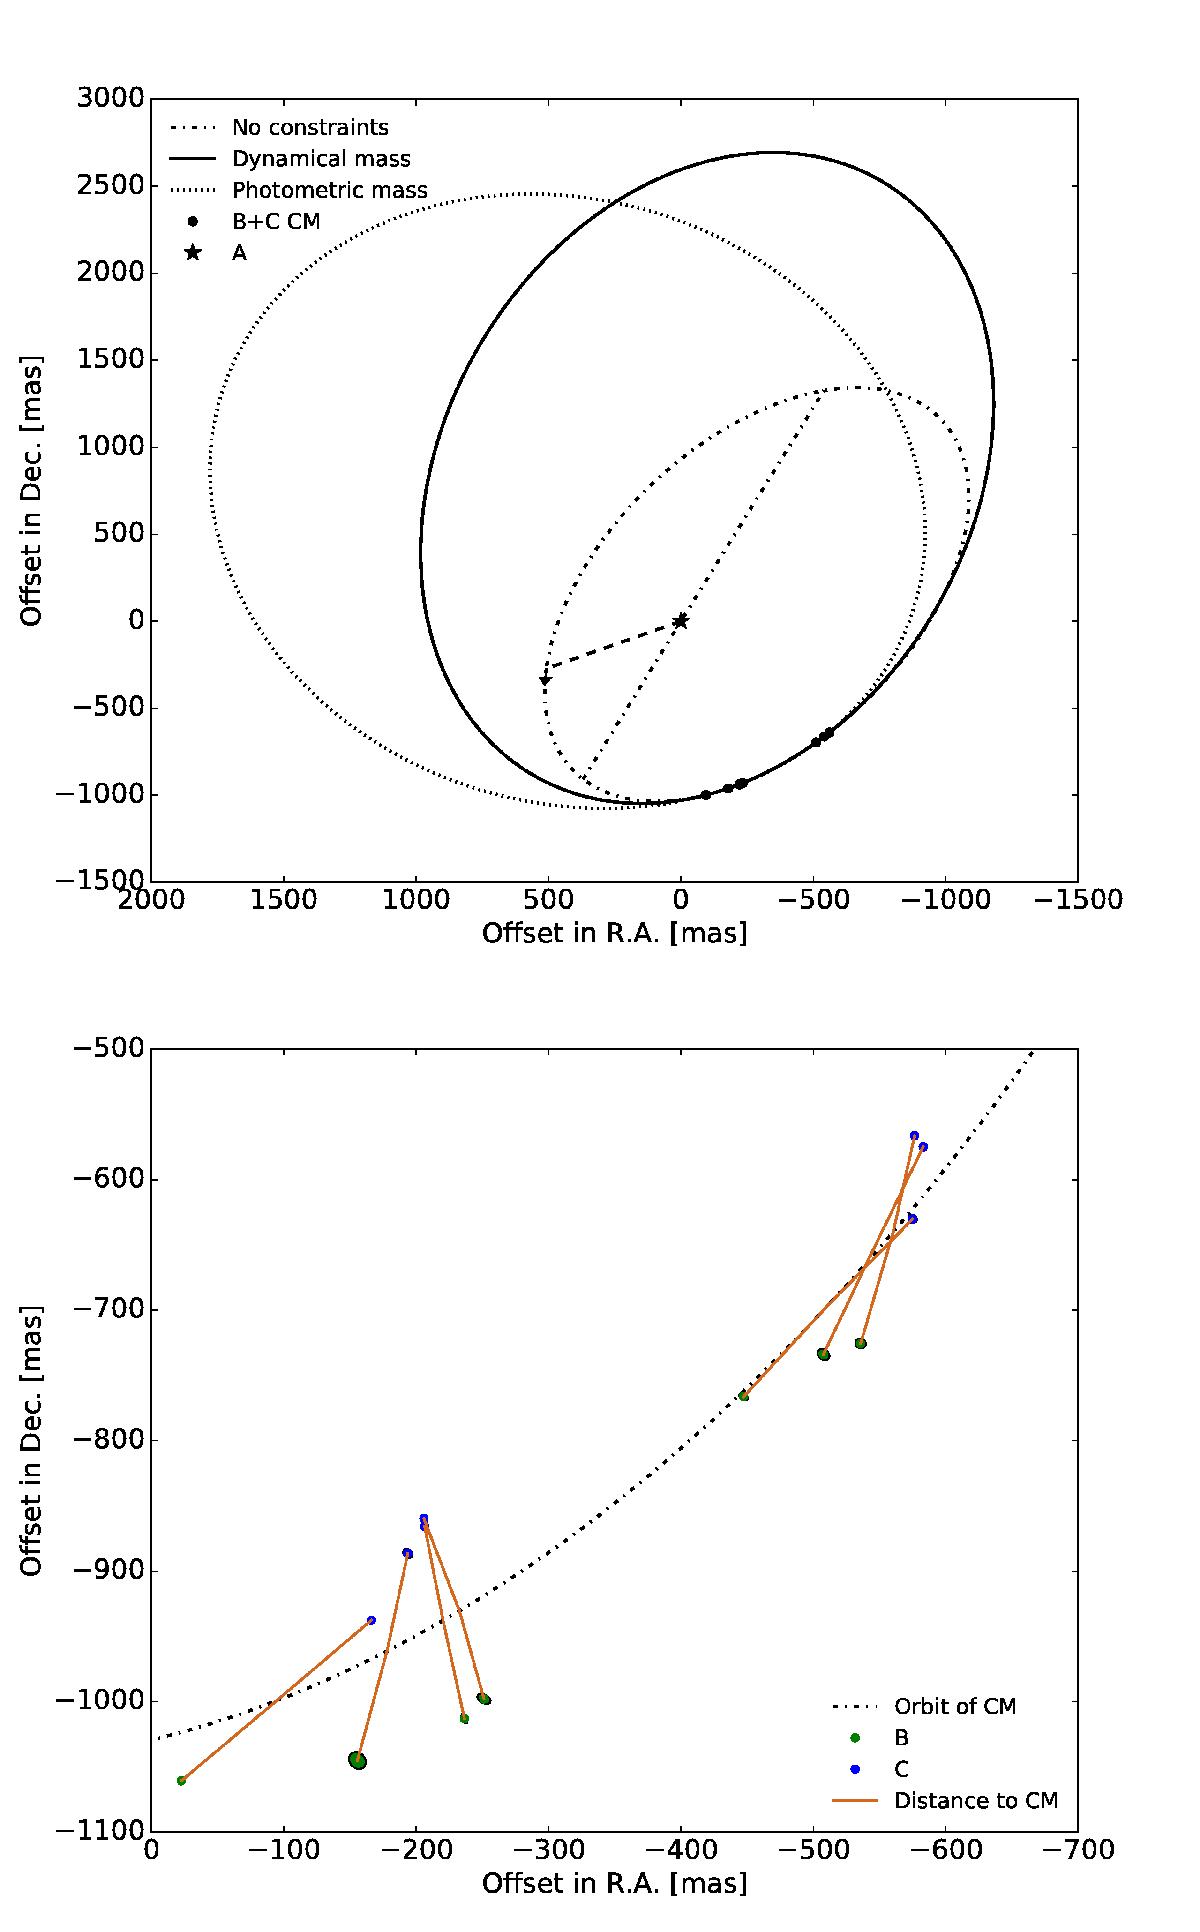
Motion of J1036 B and C centre of mass in the reference frame of J1036 A. Upper plot: full estimated period of the centre of mass between B and C around A for our fit using no mass constraints (dashed), our dynamical mass of the system as Mest,dyn = 1.0 ± 0.3 M⊙ (solid), and the photometric mass estimate of the system as Mest,phot = 0.65 ± 0.2 M⊙. Lower plot: same as the above but zoomed in on the observed data points where the ellipsis depicts the errors of the B (green) and C (blue) component positions. The brown lines connect B and C to the computed centre of mass. Only ≈35° of the full orbit has been covered and thus may not be well represented here.
Current usage metrics show cumulative count of Article Views (full-text article views including HTML views, PDF and ePub downloads, according to the available data) and Abstracts Views on Vision4Press platform.
Data correspond to usage on the plateform after 2015. The current usage metrics is available 48-96 hours after online publication and is updated daily on week days.
Initial download of the metrics may take a while.