Fig. 7
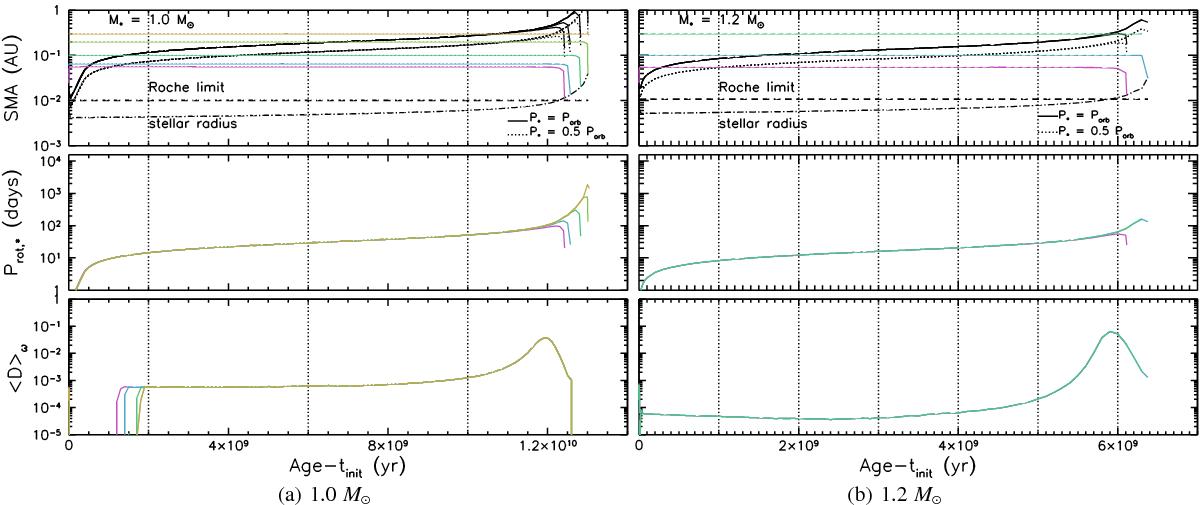
Evolution of the orbital distance of a Jupiter mass planet with different initial semi-major axis (top panel), the stellar rotation period (middle panel) and the stellar dissipation factor (bottom panel) during the evolved phases (sub-giant and early RGB) of a 1.0 M⊙ (left) and 1.2 M⊙ (right) star. Top panel: the orbital distance of the planet is represented in full coloured lines. The full black lines correspond to the co-rotation distance (Porb = P⋆), and the dotted black lines to Porb = 0.5 P⋆ delimiting the region where the dynamical tide operates. The long dashed black line corresponds to the Roche limit and the dashed-dotted line to the stellar radius. Middle panel: the surface rotation period (in days) of the host star. Bottom panel: the stellar dissipation ![]() . The time on the x-axis is given from an initial time tinit, which corresponds to the time of the protoplanetary disc dispersal. This initial time is taken to be 5 Myr.
. The time on the x-axis is given from an initial time tinit, which corresponds to the time of the protoplanetary disc dispersal. This initial time is taken to be 5 Myr.
Current usage metrics show cumulative count of Article Views (full-text article views including HTML views, PDF and ePub downloads, according to the available data) and Abstracts Views on Vision4Press platform.
Data correspond to usage on the plateform after 2015. The current usage metrics is available 48-96 hours after online publication and is updated daily on week days.
Initial download of the metrics may take a while.