Free Access
Fig. 3
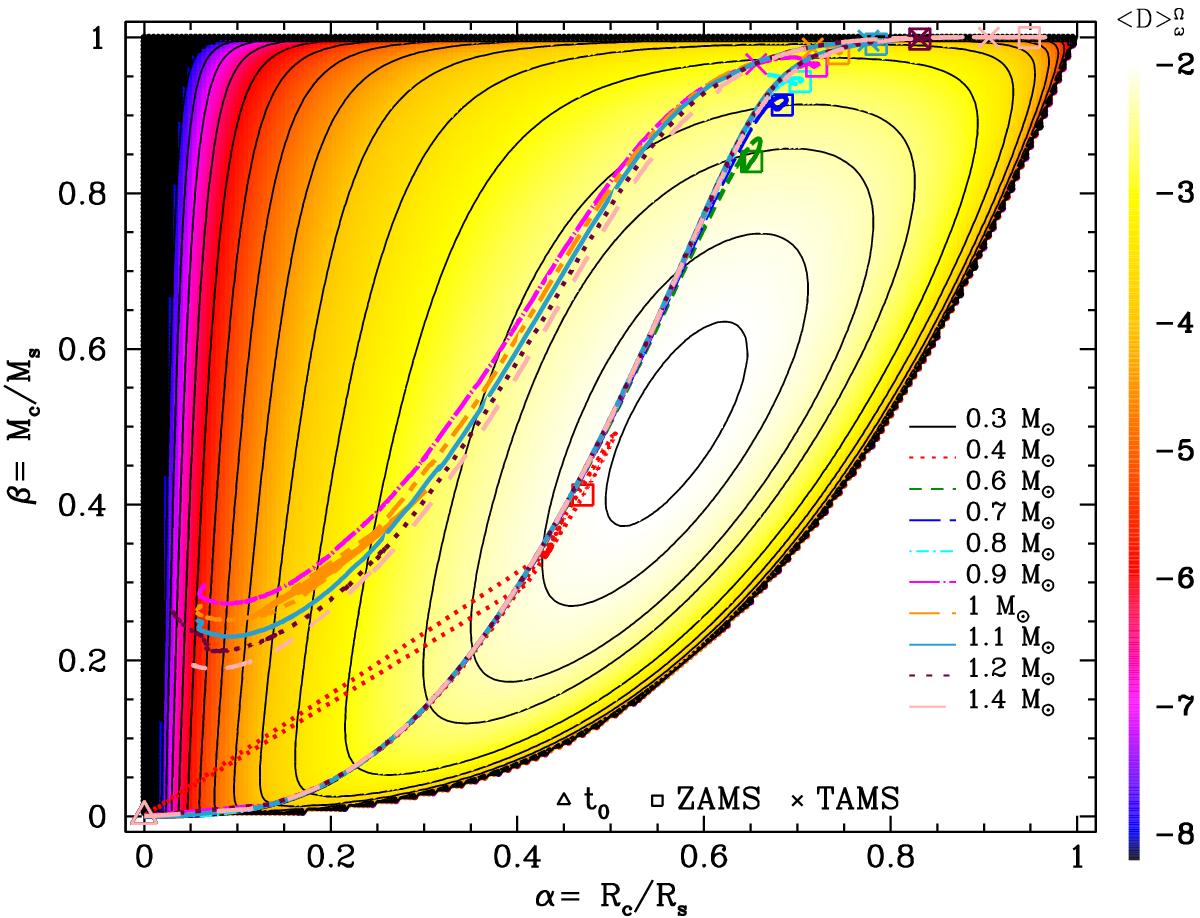
Variation of normalized dissipation ![]() as a function of the radius and mass aspect ratios (α and β, respectively) in colour scale. Levels are for
as a function of the radius and mass aspect ratios (α and β, respectively) in colour scale. Levels are for ![]() , and − 8 }. The evolutionary paths of the stellar models of the different masses (see labels) are overplotted in the (α,β) plane. Symbols are the same as in Fig. 1.
, and − 8 }. The evolutionary paths of the stellar models of the different masses (see labels) are overplotted in the (α,β) plane. Symbols are the same as in Fig. 1.
Current usage metrics show cumulative count of Article Views (full-text article views including HTML views, PDF and ePub downloads, according to the available data) and Abstracts Views on Vision4Press platform.
Data correspond to usage on the plateform after 2015. The current usage metrics is available 48-96 hours after online publication and is updated daily on week days.
Initial download of the metrics may take a while.