Free Access
Fig. 2
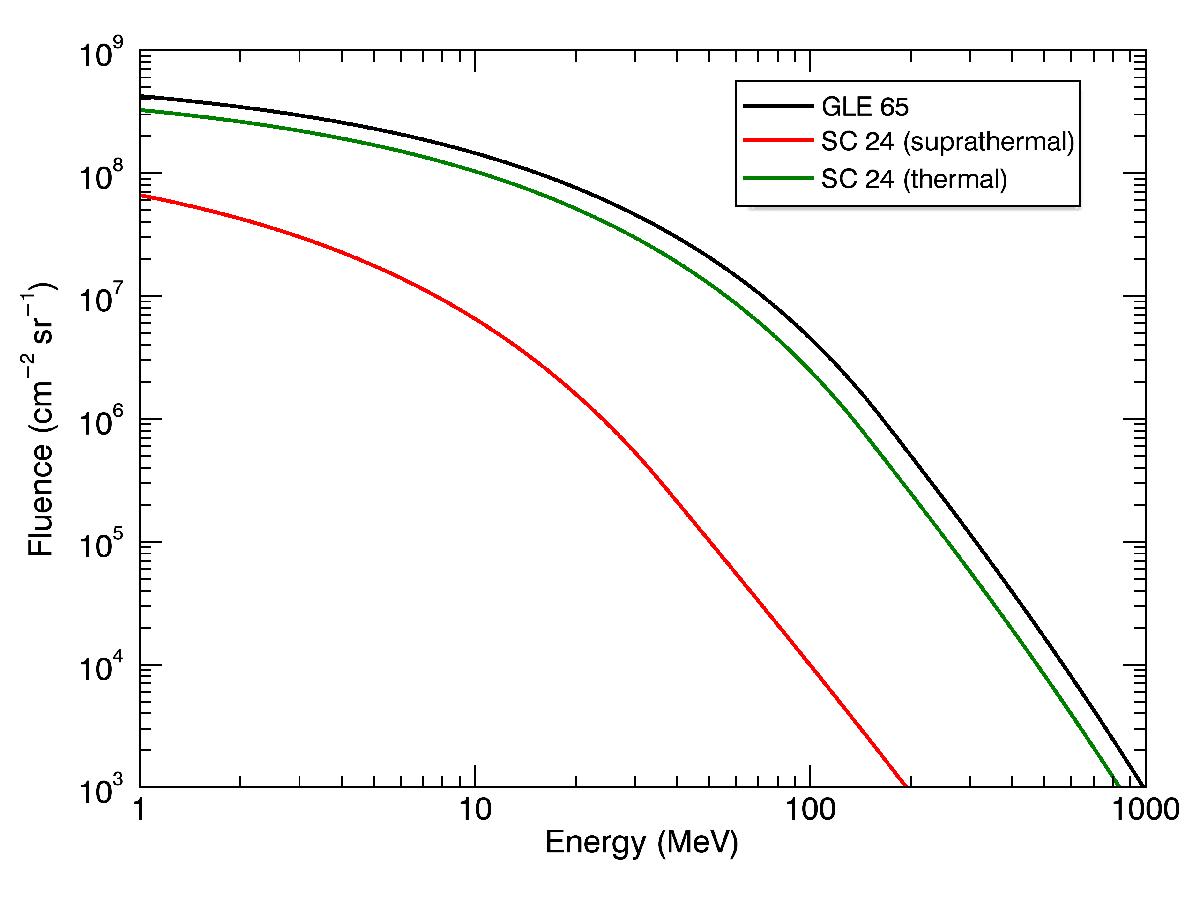
Total integral fluence of the GLE of 28 Oct. 2003 (black curve) plotted as a function of energy (Tylka & Dietrich 2009) and the same event with spectral parameters J0 and R0 scaled according to the plasma densities and suprathermal particle densities of the two cycles.
Current usage metrics show cumulative count of Article Views (full-text article views including HTML views, PDF and ePub downloads, according to the available data) and Abstracts Views on Vision4Press platform.
Data correspond to usage on the plateform after 2015. The current usage metrics is available 48-96 hours after online publication and is updated daily on week days.
Initial download of the metrics may take a while.