Fig. 9
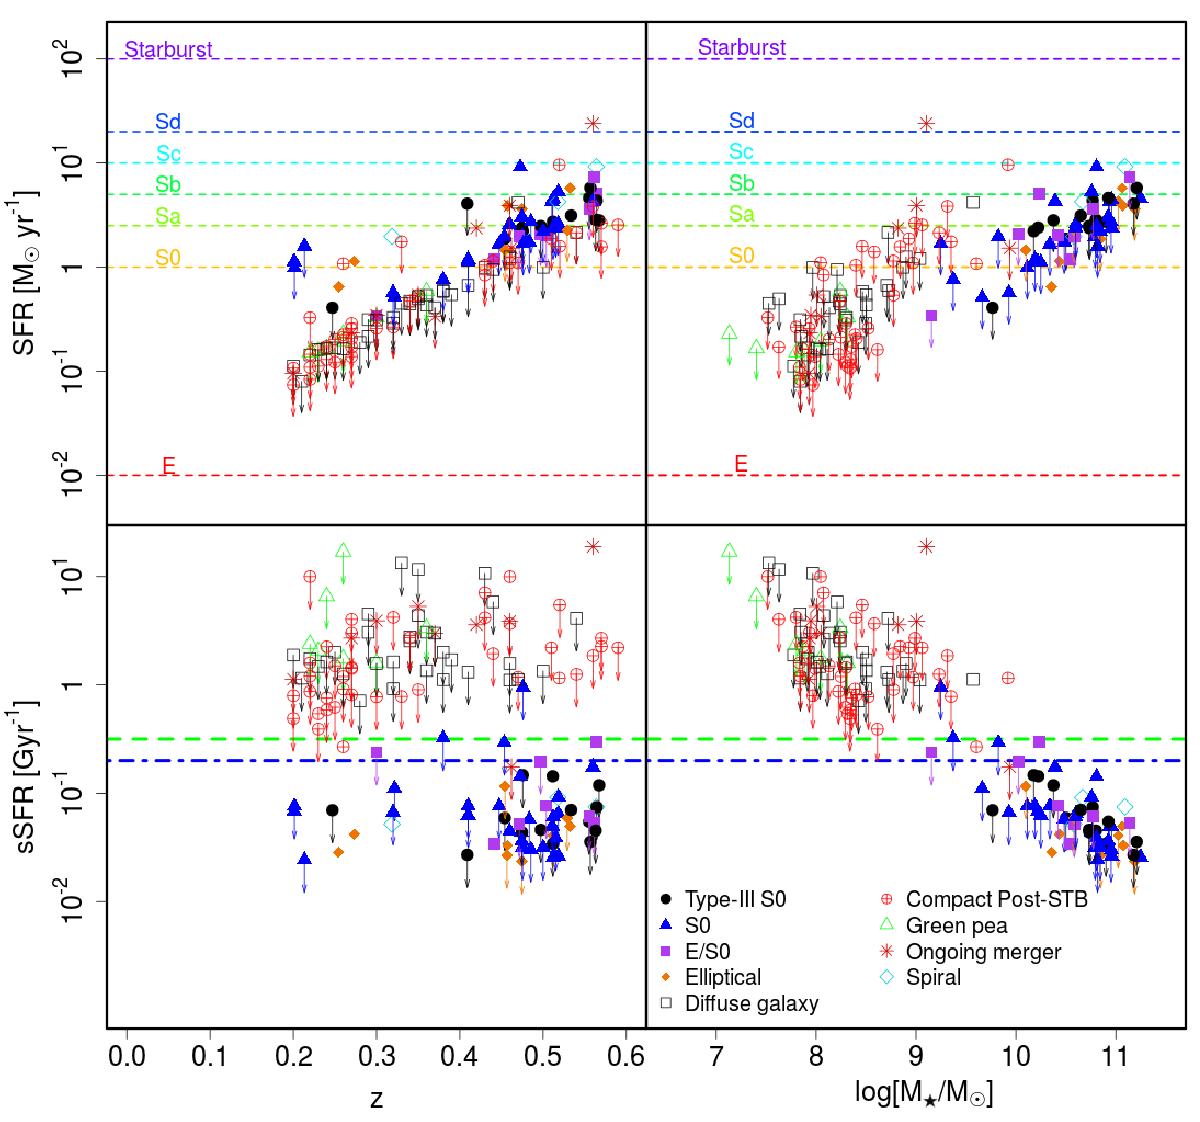
SFR (top row) and sSFR (bottom row) for the objects of the initial red sequence sample, as a function of z (left column) and the stellar mass (right column), according to their morphological types. Arrows indicate upper limits for the SFRs. The horizontal dashed lines in the top panels represent the typical values for the SFR for different morphological types in the local universe (see references in the text). Note that these values change with z (see the text). The blue dash-dotted line and the green dashed line in the bottom panels correspond to two typical reference upper limits for the sSFR in early-type galaxies (see the text). Consult the legend in the figure for the morphological type.
Current usage metrics show cumulative count of Article Views (full-text article views including HTML views, PDF and ePub downloads, according to the available data) and Abstracts Views on Vision4Press platform.
Data correspond to usage on the plateform after 2015. The current usage metrics is available 48-96 hours after online publication and is updated daily on week days.
Initial download of the metrics may take a while.