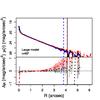
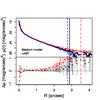
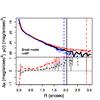
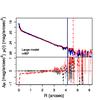
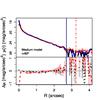
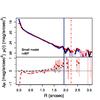
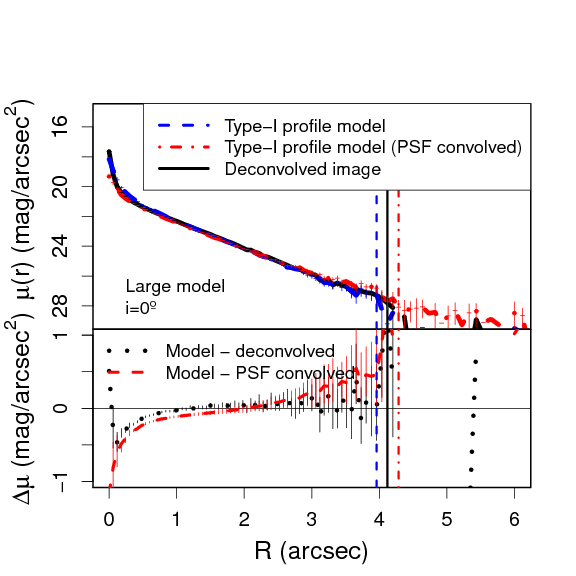
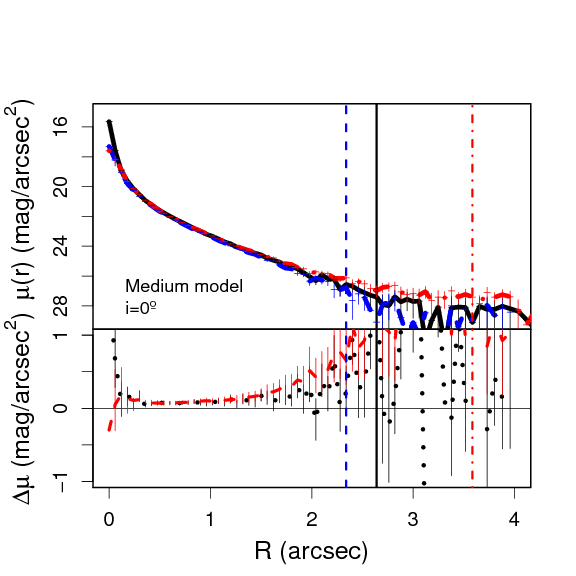
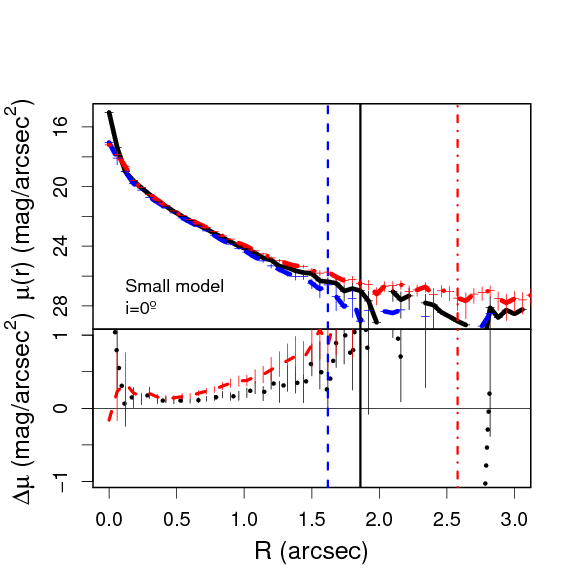
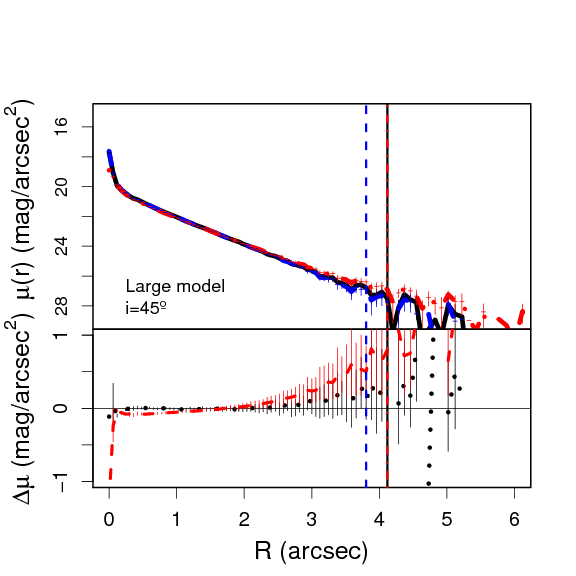
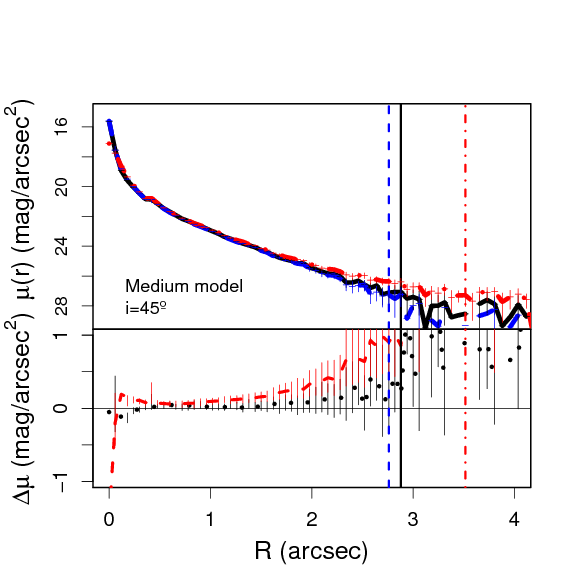
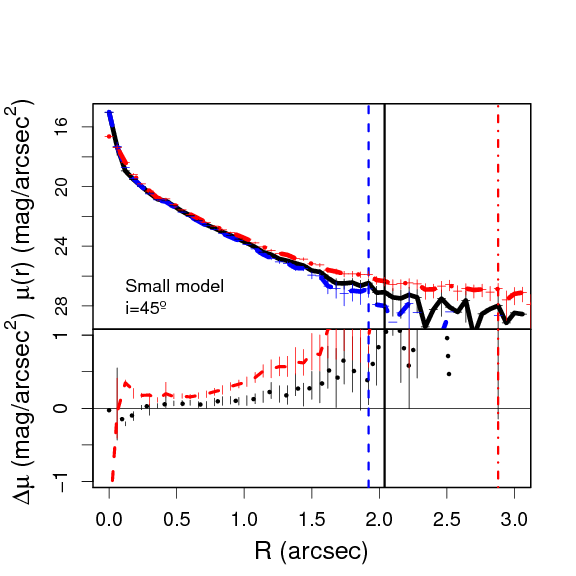
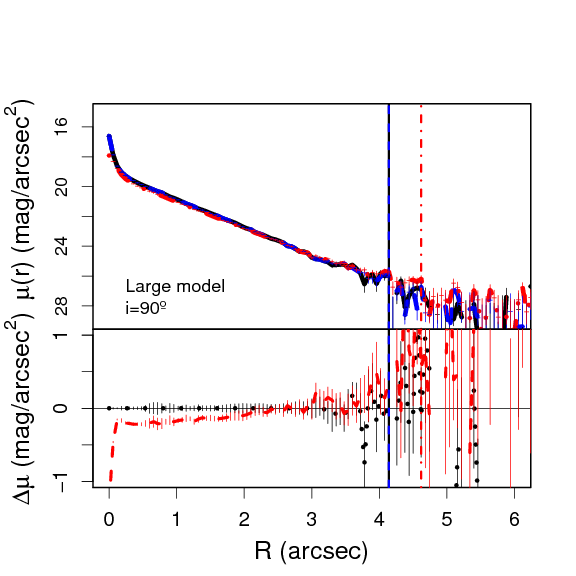
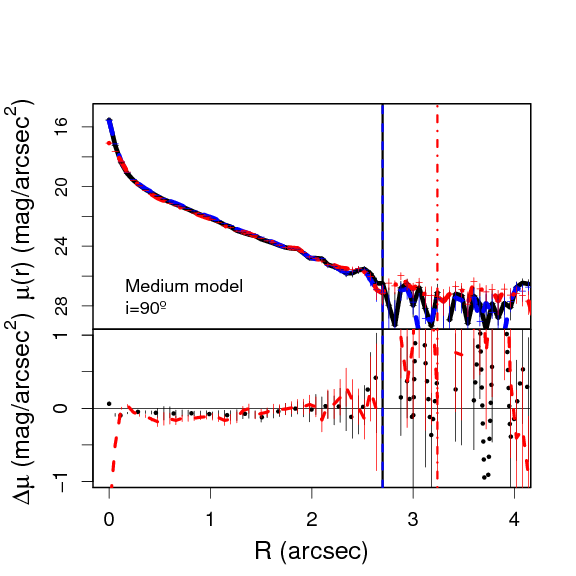
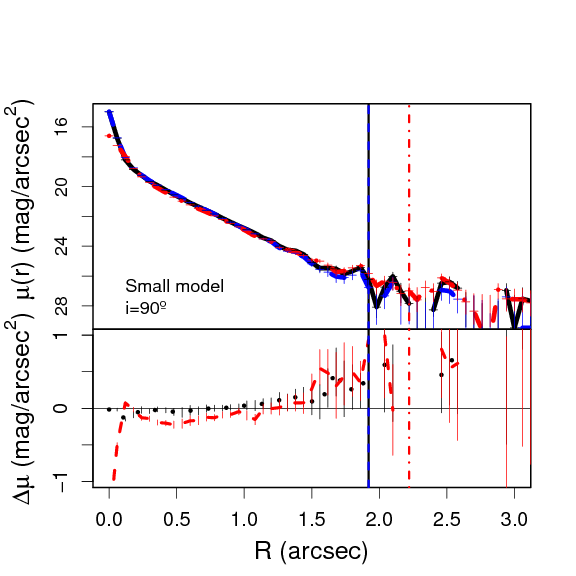
Fig. 8
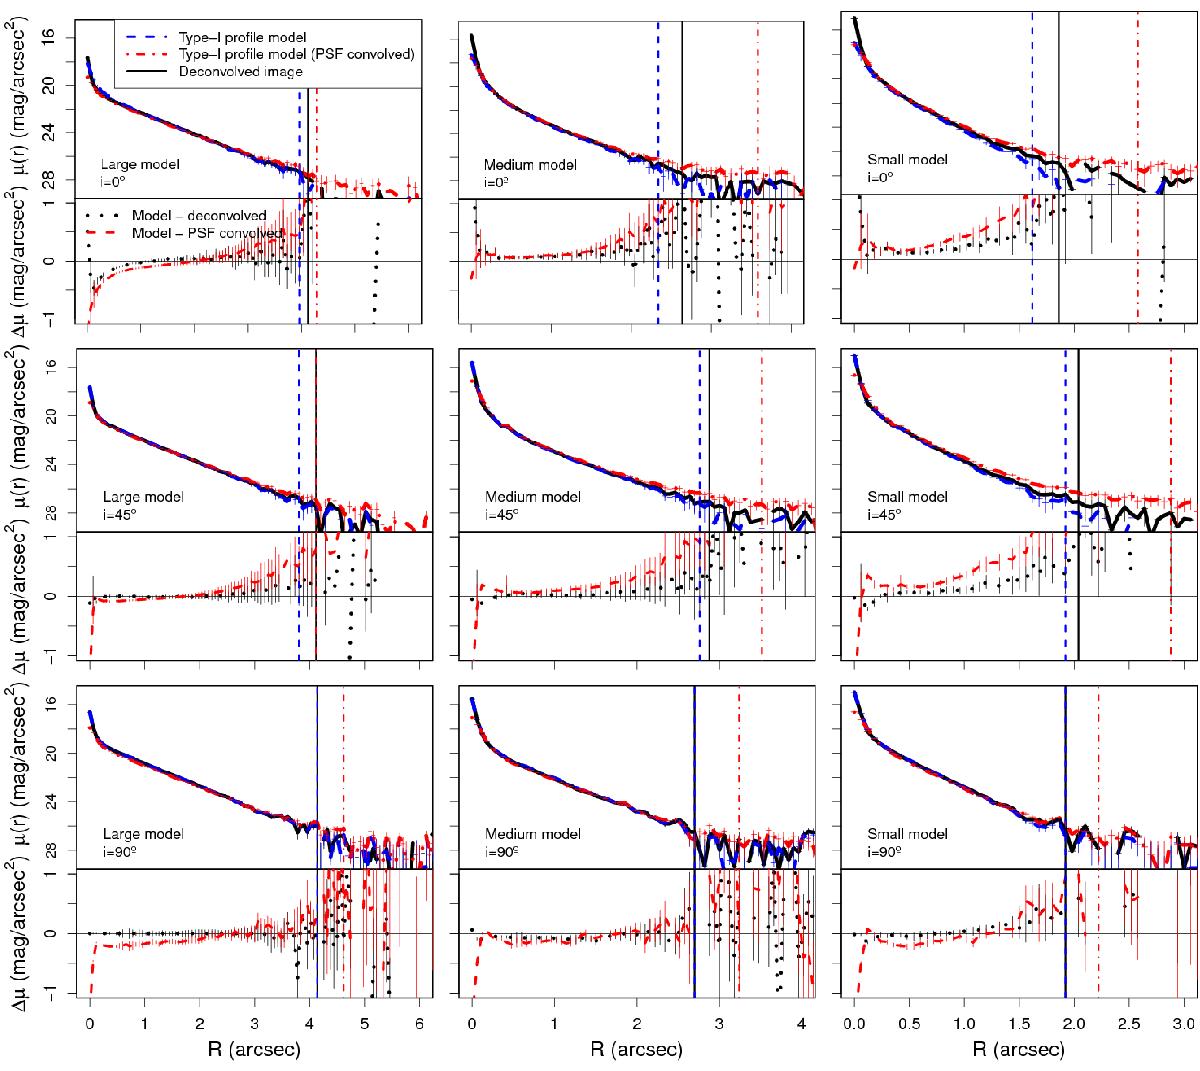
Surface brightness profiles of the synthetic images of galaxies: Top panels: i = 0°. Middle panels: i = 45°. Bottom panels: i = 90°. Left column: large sized model. Middle column: medium sized model. Right column: small sized model. Blue dashed profile: non-PSF affected surface brightness profile (real profile). Red dashed-dotted profile: PSF-affected surface brightness profile (analogous to our original uncorrected data). Black solid profile: PSF-corrected surface brightness profile. The vertical solid lines represent the limiting radius of each profile (solid black line: PSF-corrected profile, dashed blue line: non-PSF affected model profile, dashed-dotted red line: PSF-convolved model profile). Lower panels: black dotted line differences between the non-PSF affected and the corrected surface brightness profile. Dashed line differences between the non-PSF affected and the PSF affected surface brightness profile.
Current usage metrics show cumulative count of Article Views (full-text article views including HTML views, PDF and ePub downloads, according to the available data) and Abstracts Views on Vision4Press platform.
Data correspond to usage on the plateform after 2015. The current usage metrics is available 48-96 hours after online publication and is updated daily on week days.
Initial download of the metrics may take a while.