Fig. 6
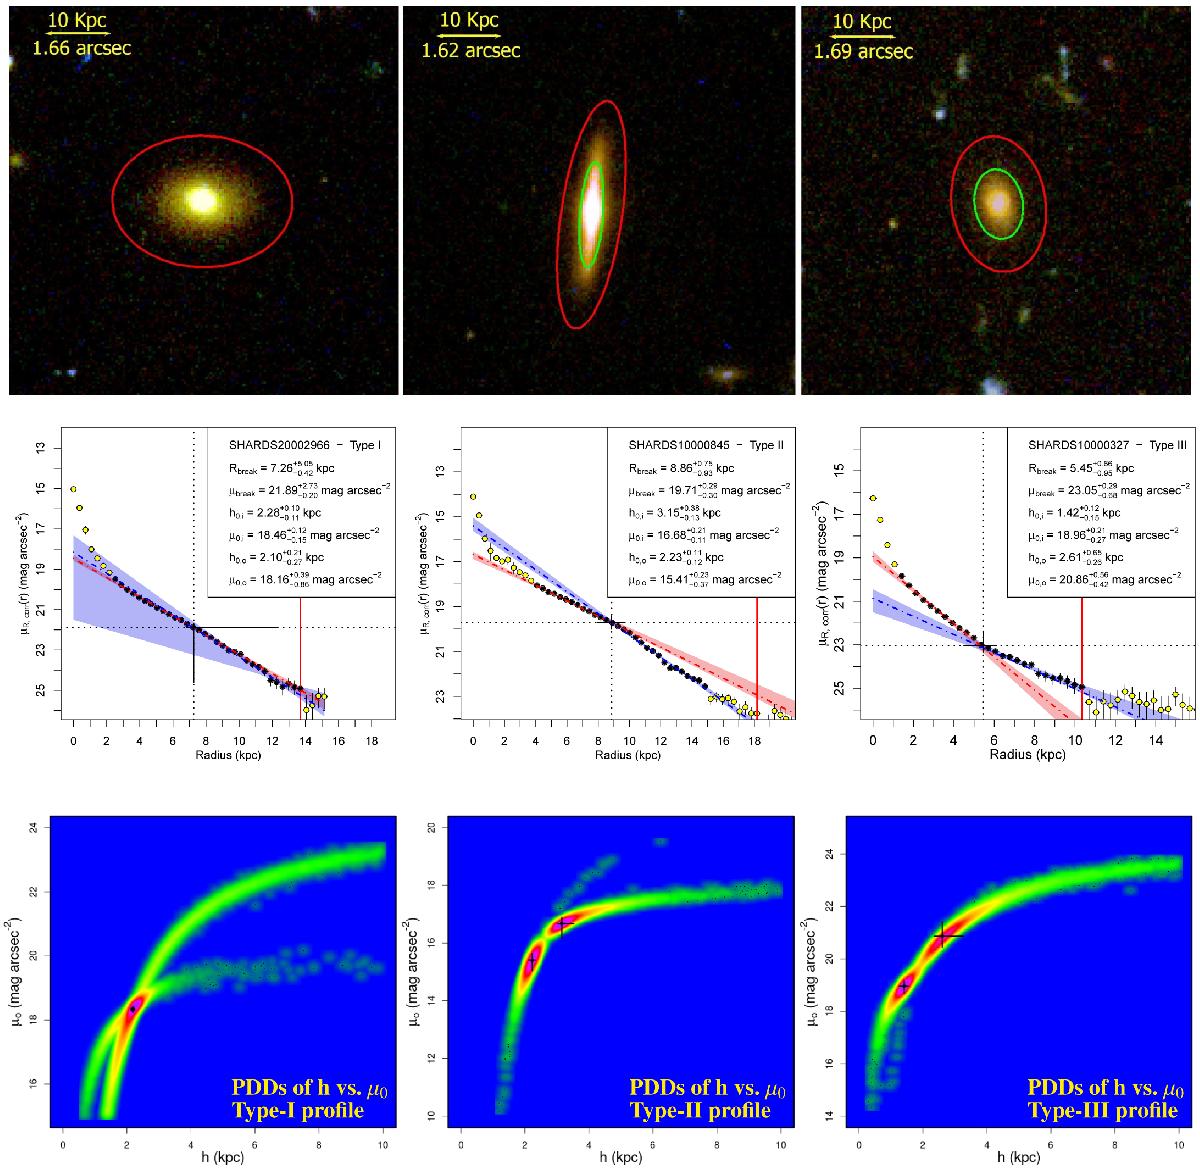
Examples of the three kinds of disc profiles in our sample of S0 and E/S0 galaxies and their analysis. Columns, from left to right: 1) Type I: SHARDS20002966; 2) Type II: SHARDS10000845; 3) Type III: SHARDS10000327. Upper row: RGB composed images of the objects using the HST/ACS filters F435W (blue), F606W (green) and F775W (red). The total FoV is 10 × 10 arcsec2. The red ellipse marks where the surface brightness profile presents a S/N = 3. The green ellipse indicates the location of the break if the profile is a Type II or III. The yellow bar represents 10 kpc in physical size. Middle row: surface brightness profiles in the rest-frame R band corrected for the dust extinction, cosmological dimming and K-correction of the corresponding objects. Only the black filled points where included in the final break fit. The yellow points were removed from the fit to avoid bulge light contamination or are outside the limiting radius. The red and blue dashed-dotted lines represent the best fits to the inner and outer regions of the disc, and the coloured uncertainty regions around them represent the 1σ confidence interval of each fit, respectively. The red vertical line represents the limiting radius for considering data points in the fit (S/N = 3). The dotted lines indicate the most probable break location in the profile (note the high uncertainty in the Type-I profile). Lower row: 2D probability density distributions (PDDs) for the scale-length h and central surface brightness μ0 decompositions. We note that in the case of SHARDS1000327 and SHARDS10000845 the PDDs show two peaks where the inner and outer profiles are located, while in SHARDS20002966 the solutions for the two profiles peak around an unique point. The rainbow-like colour scale represents probability density, with redder colours indicating higher values.
Current usage metrics show cumulative count of Article Views (full-text article views including HTML views, PDF and ePub downloads, according to the available data) and Abstracts Views on Vision4Press platform.
Data correspond to usage on the plateform after 2015. The current usage metrics is available 48-96 hours after online publication and is updated daily on week days.
Initial download of the metrics may take a while.