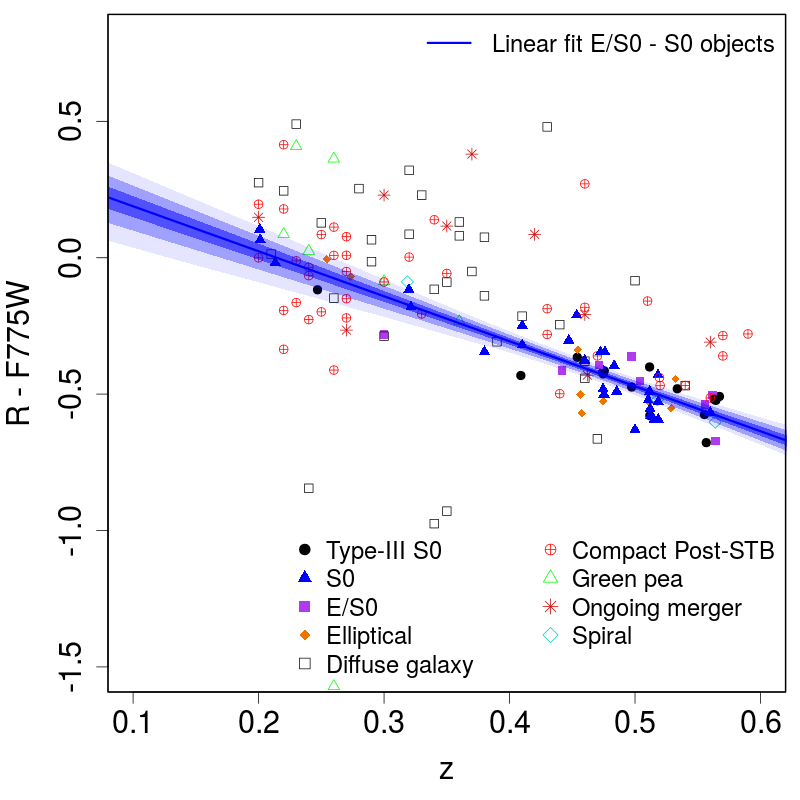
Fig. 5
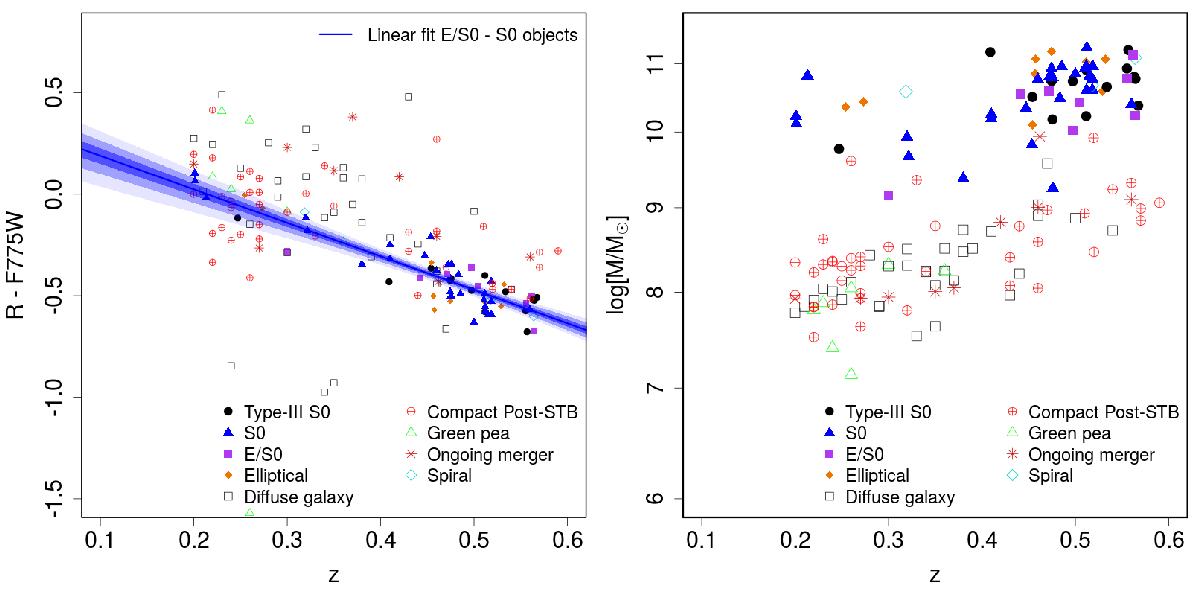
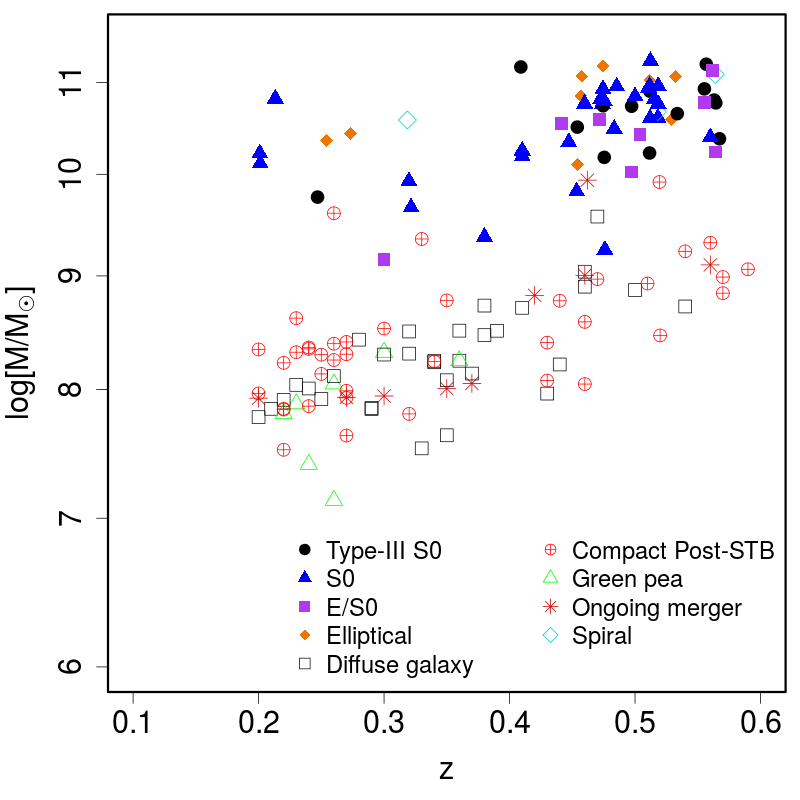
Left panel: estimated K-correction for the F775W filters to the R band as a function of z. It is important to highlight that the linear fit applies to the observed correlation of the S0 and E/S0 galaxies of the sample. The intensity levels of the linear fit represent the 1, 2 and 3σ confidence regions of the fit. Right panel: stellar mass for the initial red sequence sample vs. z. Consult the legend in the figure for the morphological classification.
Current usage metrics show cumulative count of Article Views (full-text article views including HTML views, PDF and ePub downloads, according to the available data) and Abstracts Views on Vision4Press platform.
Data correspond to usage on the plateform after 2015. The current usage metrics is available 48-96 hours after online publication and is updated daily on week days.
Initial download of the metrics may take a while.