Fig. 3
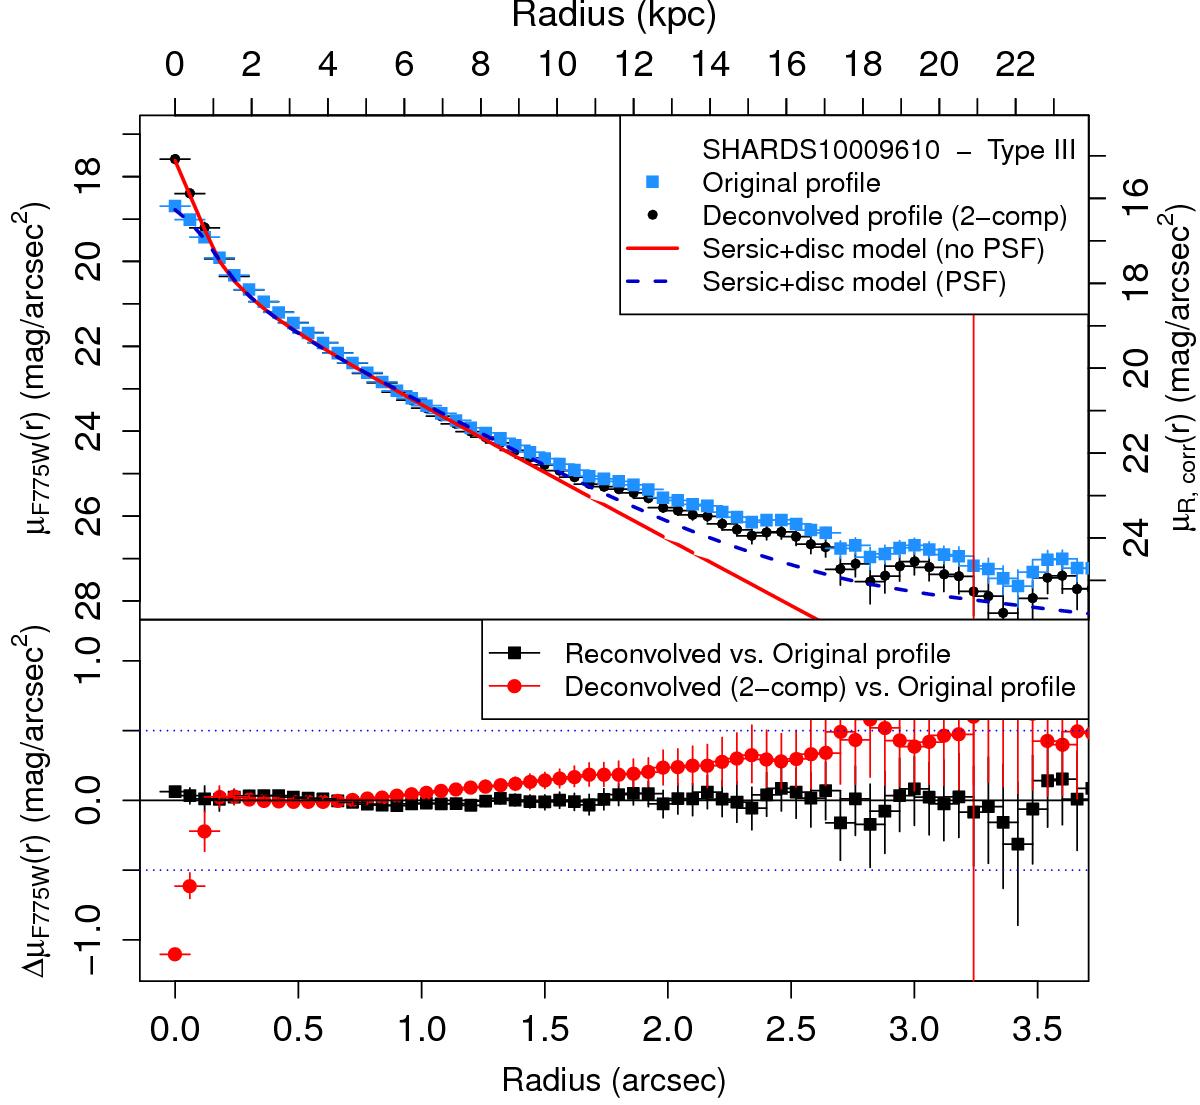
Top panel: surface brightness profiles of the Type-III S0 galaxy SHARDS10009610. Blue squares: surface brightness profile of the original image. Black dots: the same for the PSF-corrected image (black). We represent the magnitude scale for the observed F775W band (left axis) and for the rest-frame R band (right axis). The red solid and blue dashed lines correspond to the models fitted during the deconvolution and used for checking the visual morphological selection (see the legend). Bottom panel: residuals between the original and corrected profiles. Red circles: difference between the original and the PSF-corrected profiles. We note that the PSF effects create a systematic upturn beyond ~1.0 arcsec. Black squares: difference between the original profile and the reconvolved PSF-corrected image profile. The vertical red line represents the limiting radius.
Current usage metrics show cumulative count of Article Views (full-text article views including HTML views, PDF and ePub downloads, according to the available data) and Abstracts Views on Vision4Press platform.
Data correspond to usage on the plateform after 2015. The current usage metrics is available 48-96 hours after online publication and is updated daily on week days.
Initial download of the metrics may take a while.