Fig. C.1
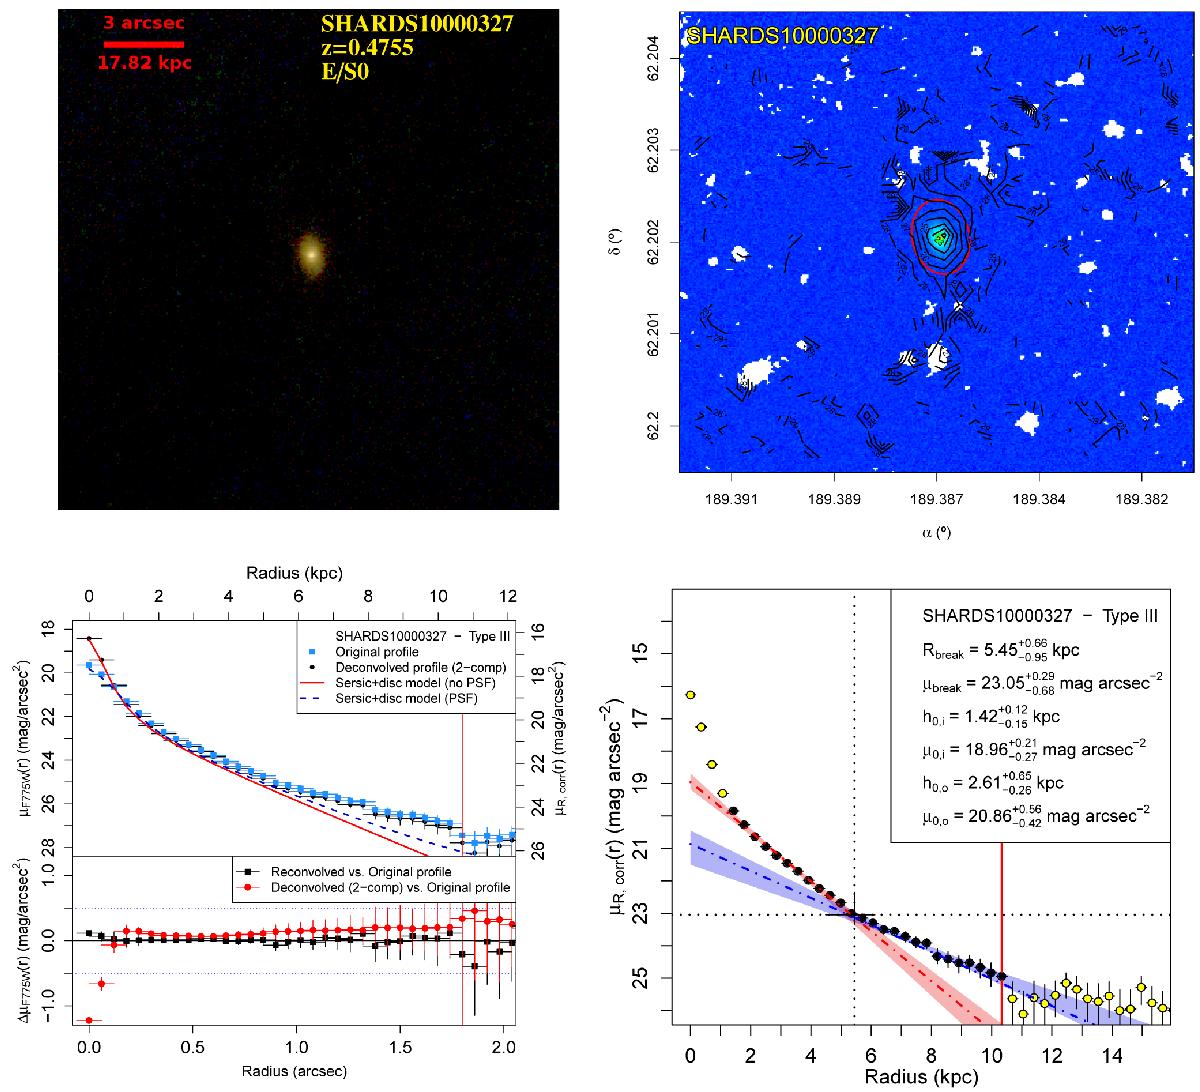
Upper row, left panel: masked false RGB image centred on the source (red: F775W, green: F606W, blue: F435W). The red segment represents 3 arcsec. Upper row, right panel: deconvolved F775W image. The black lines represent the isophotal contours of the image in magnitudes. The white regions represent the masked areas. The red ellipse indicates the limiting radius. Lower row, left panel: surface brightness profiles of the original image (blue) and the PSF-corrected image (black) for the observed F775W band (left axis) and for the rest-frame Steidel R band (right axis). The red solid and blue dashed lines correspond to the models fitted during the deconvolution and used for checking the visual morphological selection (see the legend). The lower panel represents the differences between the original and the PSF-corrected profiles (red circles) and the difference between the original profile and the reconvolved PSF-corrected image profile (black squares). The vertical red line represents the limiting radius. Lower row, right panel: surface brightness profile in the rest-frame Steidel R band corrected for dust extinction, cosmological dimming and K-correction. The dashed lines and the shaded areas correspond to the exponential fittings of the inner and outer profiles in red and blue colours, respectively. The vertical and horizontal black dotted lines correspond to the peak of the PDD for the break radius and the surface brightness value at that location (Rbreak and μbreak). The results of the break analysis are provided in the panel.
Current usage metrics show cumulative count of Article Views (full-text article views including HTML views, PDF and ePub downloads, according to the available data) and Abstracts Views on Vision4Press platform.
Data correspond to usage on the plateform after 2015. The current usage metrics is available 48-96 hours after online publication and is updated daily on week days.
Initial download of the metrics may take a while.