Fig. 13
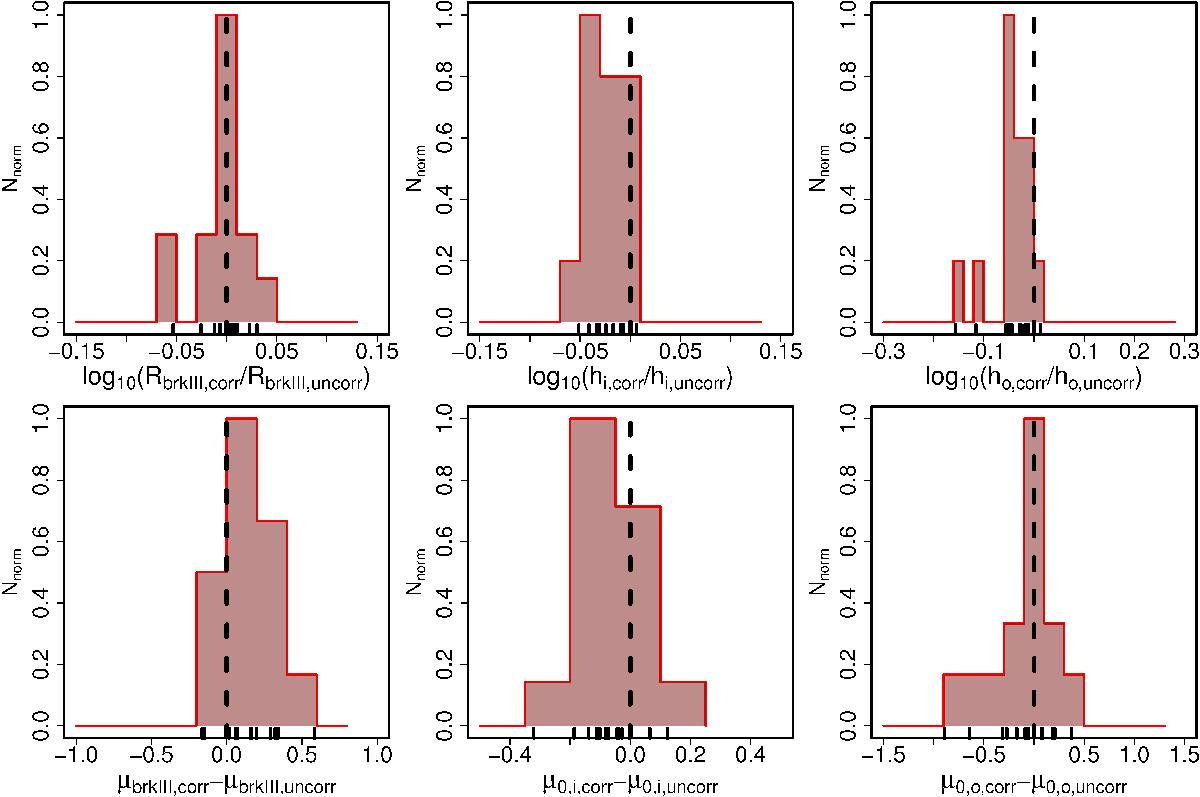
Comparison between the PSF corrected and non-corrected values of the structural and photometric parameters of the Type-III S0 and E/S0 at 0.2 <z< 0.6 sample. Upper row, from left to right: decimal logarithm of the ratio between the PSF corrected structural parameters and the same parameters measured on the original profile: break radius Rbreak (kpc), scale-length of the inner profile hi (kpc), scale-length of the outer profile ho (kpc). Lower row, from left to right: differences between the PSF corrected structural parameters and the same measured on the original profile: surface brightness at the break radius μbreak (mag arcsec-2), central surface brightness of the inner profile μ0,i (mag arcsec-2), central surface brightness of the outer profile μ0,o (mag arcsec-2). The black dashed vertical line represents the ratio or difference where the PSF correction would not have any effect.
Current usage metrics show cumulative count of Article Views (full-text article views including HTML views, PDF and ePub downloads, according to the available data) and Abstracts Views on Vision4Press platform.
Data correspond to usage on the plateform after 2015. The current usage metrics is available 48-96 hours after online publication and is updated daily on week days.
Initial download of the metrics may take a while.