Fig. 12
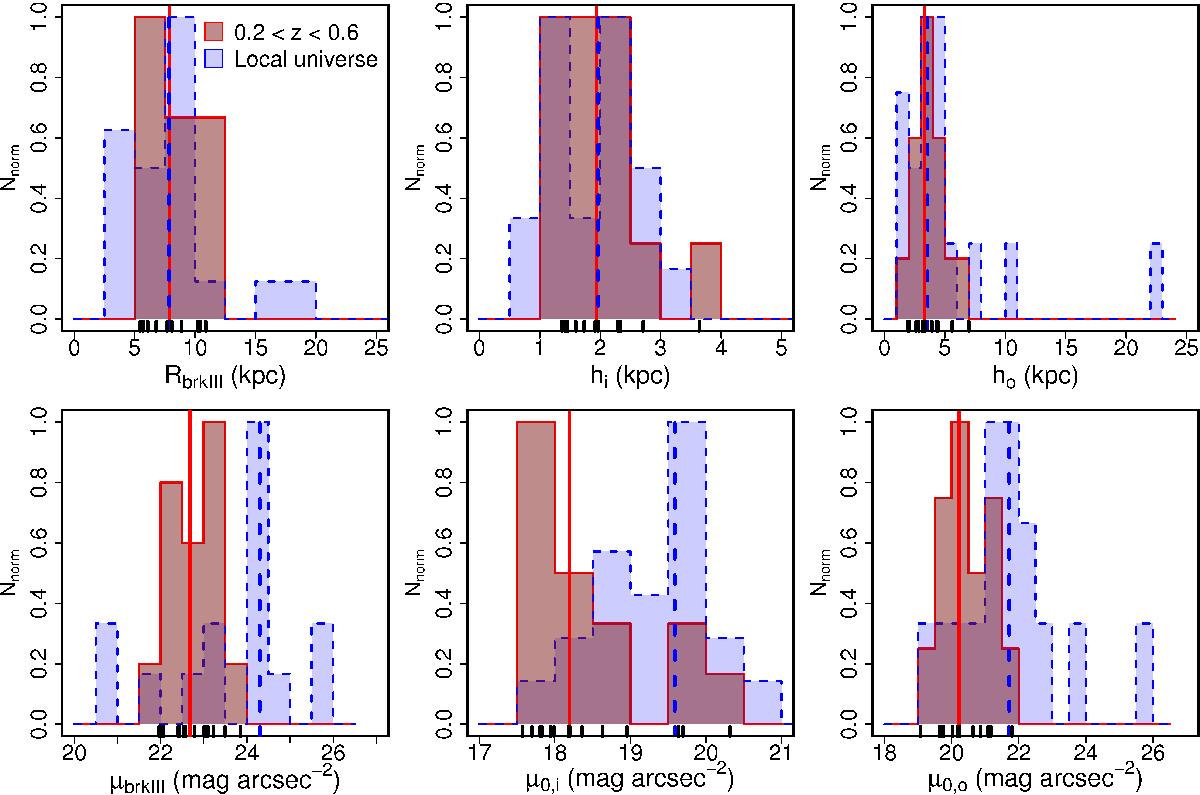
Normalised distributions of the structural and photometric parameters of the Type-III breaks of the our sample of S0 and E/S0 at 0.2 <z< 0.6, compared to those from the local universe (E08 and G11). Upper row, from left to right: break radius Rbreak (kpc), scale-length of the inner disc profile hi (kpc), scale-length of the outer profile ho (kpc). Lower row, from left to right: surface brightness at the break radius μbreak (mag arcsec-2), central surface brightness of the inner disc profile μ0,i (mag arcsec-2), central surface brightness of the outer profile μ0,o (mag arcsec-2). The red solid histogram marks our sample of Type-III S0 and E/S0 galaxies at 0.2 <z< 0.6. The blue dashed histogram represents the distributions found for local universe sample from data by E08 and G11.
Current usage metrics show cumulative count of Article Views (full-text article views including HTML views, PDF and ePub downloads, according to the available data) and Abstracts Views on Vision4Press platform.
Data correspond to usage on the plateform after 2015. The current usage metrics is available 48-96 hours after online publication and is updated daily on week days.
Initial download of the metrics may take a while.