Fig. 1
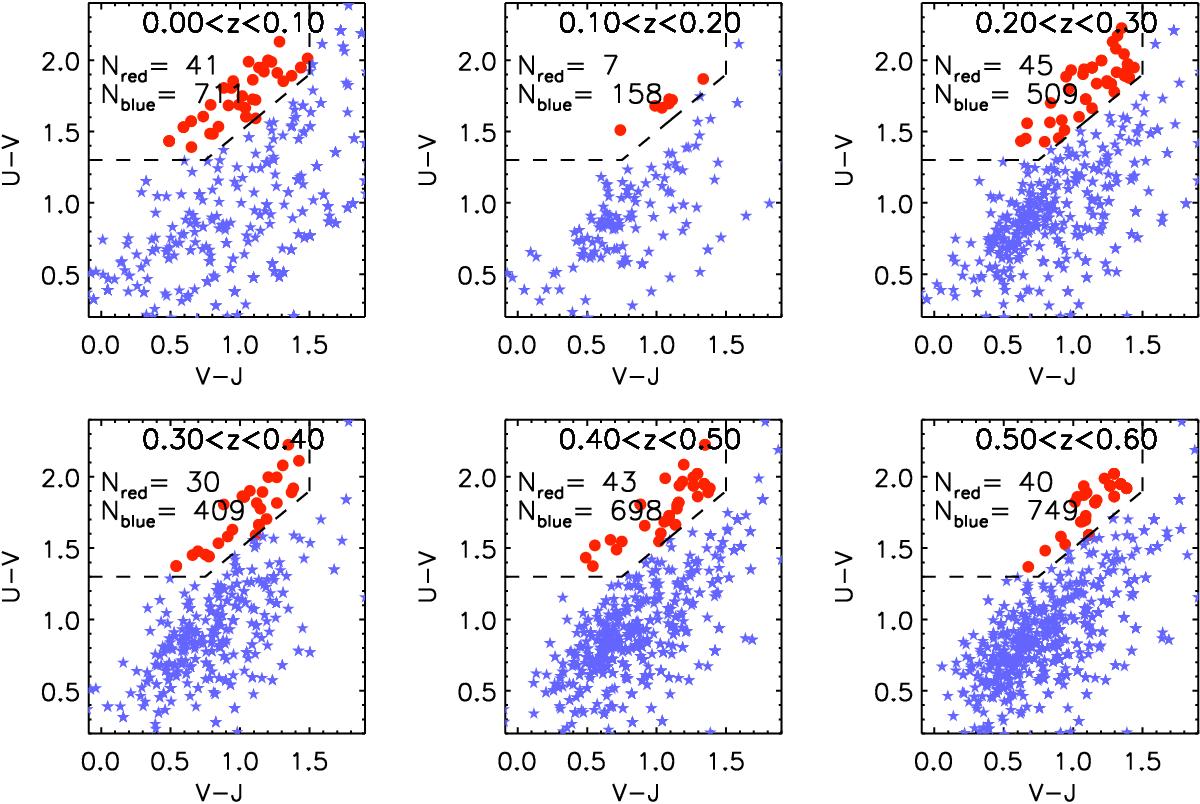
Initial sample selection with the (U − V) vs. (V − J) colour-colour diagram by redshift intervals up to z = 0.6. Dashed line: Whitaker et al. (2011, 2012) boundaries for identifying the quiescent galaxy population and the star-forming galaxies (see Eqs. (2)–(4)). Red dots: quiescent galaxies from the initial SHARDS sample. Blue stars: star-forming galaxies from the initial SHARDS sample. The number of objects selected in each class and interval of redshift are given on the panels.
Current usage metrics show cumulative count of Article Views (full-text article views including HTML views, PDF and ePub downloads, according to the available data) and Abstracts Views on Vision4Press platform.
Data correspond to usage on the plateform after 2015. The current usage metrics is available 48-96 hours after online publication and is updated daily on week days.
Initial download of the metrics may take a while.