Fig. 9
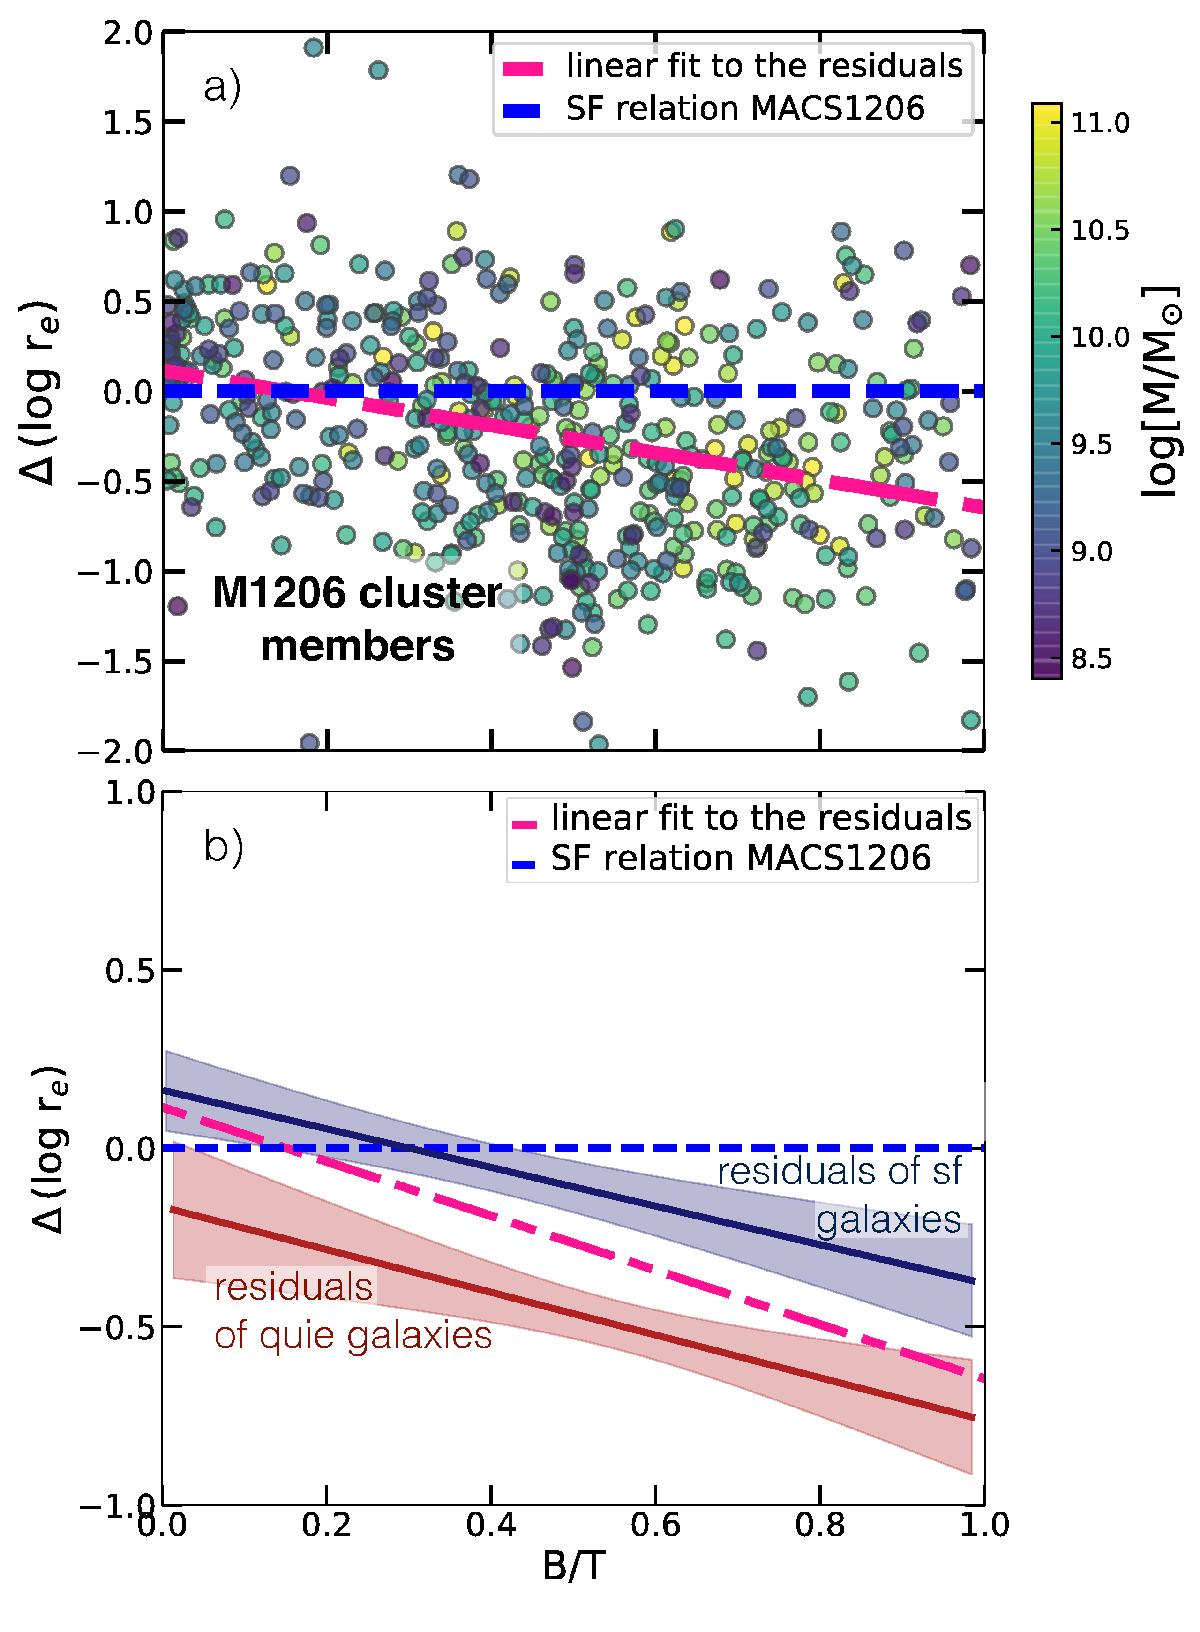
Residuals from the star forming relation vs. B/T. The plots quantify the change of bulge-to-total ratio for cluster galaxies. For each galaxy we calculated the difference in size from the relation defined by the star forming cluster galaxies (represented by blue dashed lines) and plotted these residuals as a function of B/T. Top panel: all galaxies, color-coded by their mass, to preserve this information. The pink dot-dashed line is the linear fit to all galaxies. Galaxies with higher B/T deviate most from the SF line and thus have smaller sizes. Bottom panel: linear fits (and their error bands) to star forming (blue) and quiescent (red) galaxies. We see that at the same B/T, SF galaxies are larger than QUIE galaxies. Furthermore, at higher B/T, the average behavior oscillates from the SF to the QUIE fit demonstrating that at low B/T, the larger sizes are dominated by star forming galaxies whereas at high B/T, smaller sizes are attributed to quiescent galaxies.
Current usage metrics show cumulative count of Article Views (full-text article views including HTML views, PDF and ePub downloads, according to the available data) and Abstracts Views on Vision4Press platform.
Data correspond to usage on the plateform after 2015. The current usage metrics is available 48-96 hours after online publication and is updated daily on week days.
Initial download of the metrics may take a while.