Fig. 7
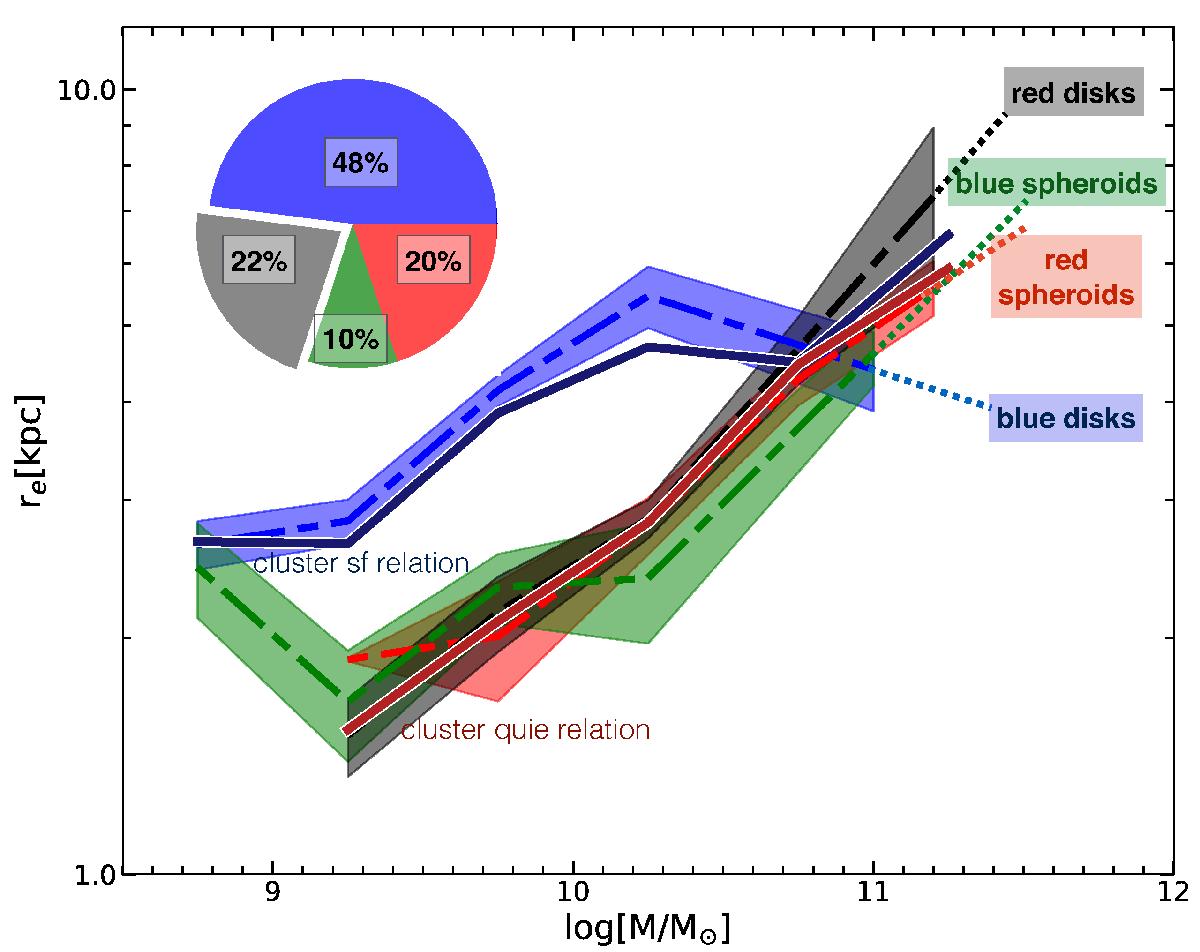
Stellar-mass–size relation for star forming galaxies with n< 2.5 (blue), star forming galaxies with n> 2.5 (green), quiescent galaxies with n> 2.5 (red), and quiescent galaxies with n< 2.5 (black). Star forming disk galaxies are much larger than all other sub-classes just above the general cluster relation for star forming galaxies. Solid lines show the weighted mean sizes in 0.5 dex mass bins of the clipped data. The shaded regions indicate the 1σ error on the mean. We also show the cluster relation for star forming and quiescent galaxies presented in Fig. 5 as solid lines for comparison and the distribution of the types in percentages.
Current usage metrics show cumulative count of Article Views (full-text article views including HTML views, PDF and ePub downloads, according to the available data) and Abstracts Views on Vision4Press platform.
Data correspond to usage on the plateform after 2015. The current usage metrics is available 48-96 hours after online publication and is updated daily on week days.
Initial download of the metrics may take a while.