Fig. 5
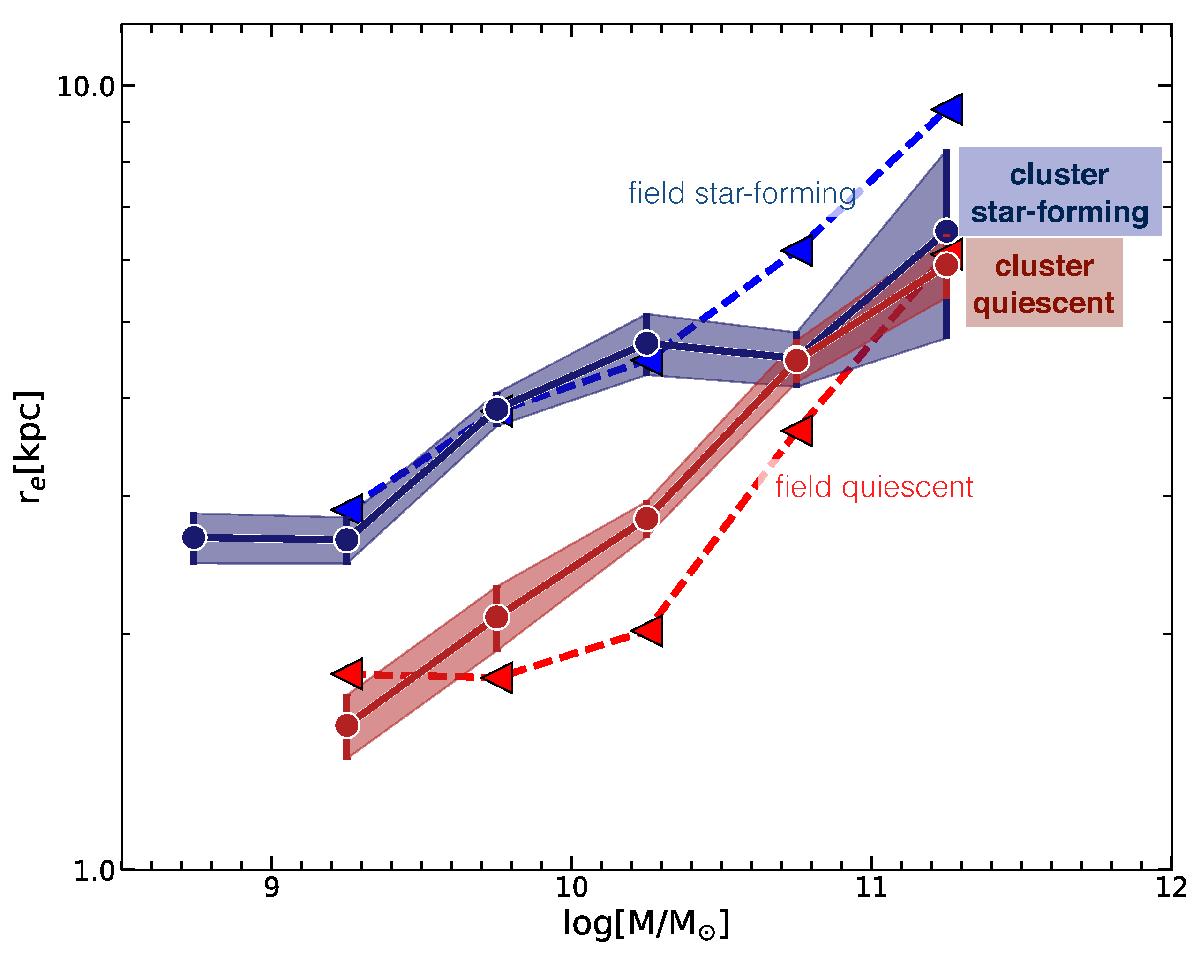
Comparison of the stellar-mass–size relations in field and MACS1206 cluster environments for star forming (blue) and quiescent (red) galaxies and their errorbars. We divide the sample into mass bins for a more detailed description of the sizes. The solid lines show the weighted mean sizes in 0.5 dex mass bins of both samples. The shaded regions indicate the 1σ error on the mean. The red and blue triangles are median points for field galaxies from van der Wel et al. (2014), their Fig. 8, interpolated to our redshift and connected by dashed lines.
Current usage metrics show cumulative count of Article Views (full-text article views including HTML views, PDF and ePub downloads, according to the available data) and Abstracts Views on Vision4Press platform.
Data correspond to usage on the plateform after 2015. The current usage metrics is available 48-96 hours after online publication and is updated daily on week days.
Initial download of the metrics may take a while.