Fig. 4
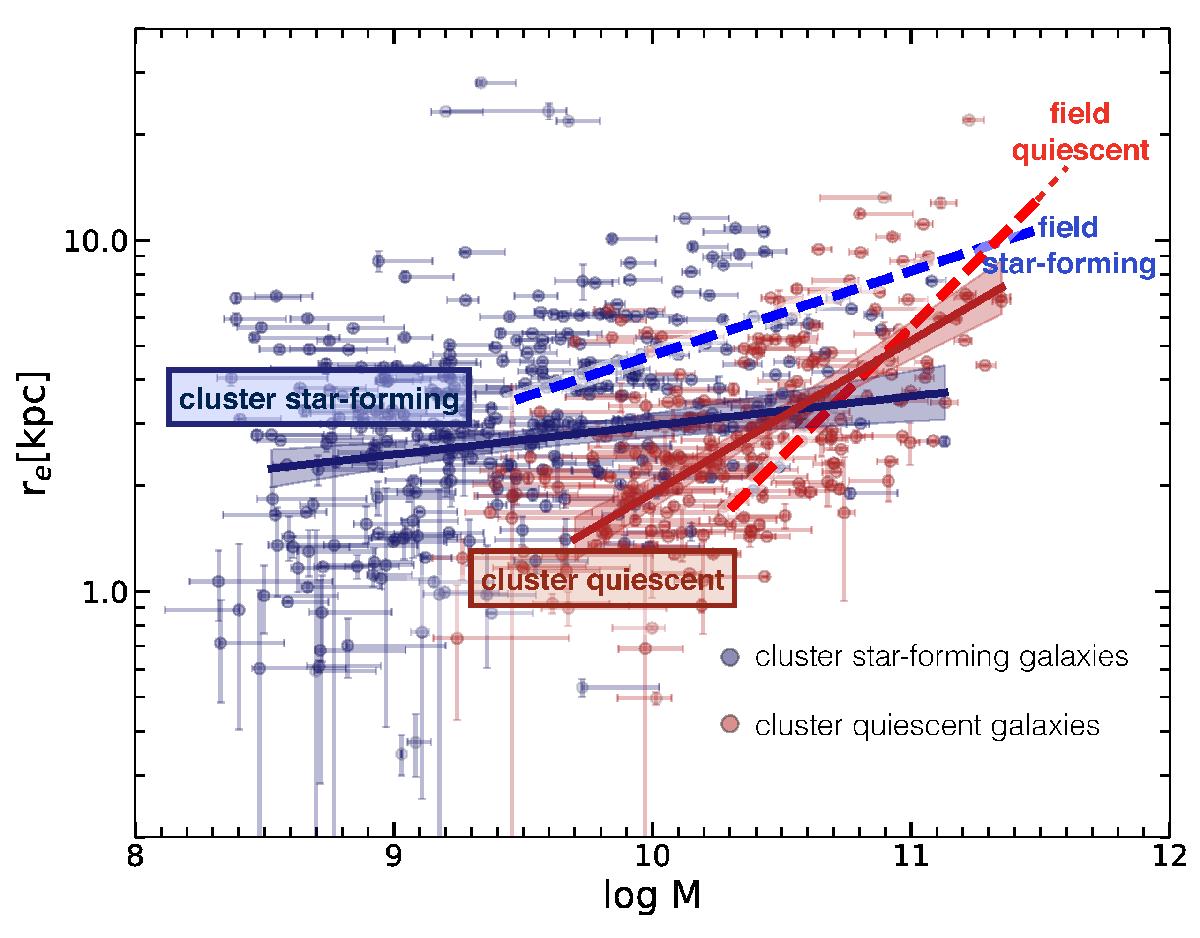
Comparison of stellar-mass–size relations of cluster galaxies in MACS1206 (solid lines) to field galaxies from (van der Wel et al. 2014) (dashed lines). This simple comparison suggests some minor differences. Points are BRI-selected star forming (blue) and quiescent (red) cluster galaxies. The blue and red solid lines are single power-law fits to the entire respective weighted data log (M/M⊙) > 8.5 for star forming and log (M/M⊙) > 9.2 for quiescent galaxies (see Appendix A). Error bars on the points indicate the 68% confidence level on the mass from SED fitting as well as (statistical) errors on the effective radii provided by GALFITM. Including these errors in the fitting routine does not change the result significantly and we indicate this change with the shaded area.
Current usage metrics show cumulative count of Article Views (full-text article views including HTML views, PDF and ePub downloads, according to the available data) and Abstracts Views on Vision4Press platform.
Data correspond to usage on the plateform after 2015. The current usage metrics is available 48-96 hours after online publication and is updated daily on week days.
Initial download of the metrics may take a while.