Fig. A.2
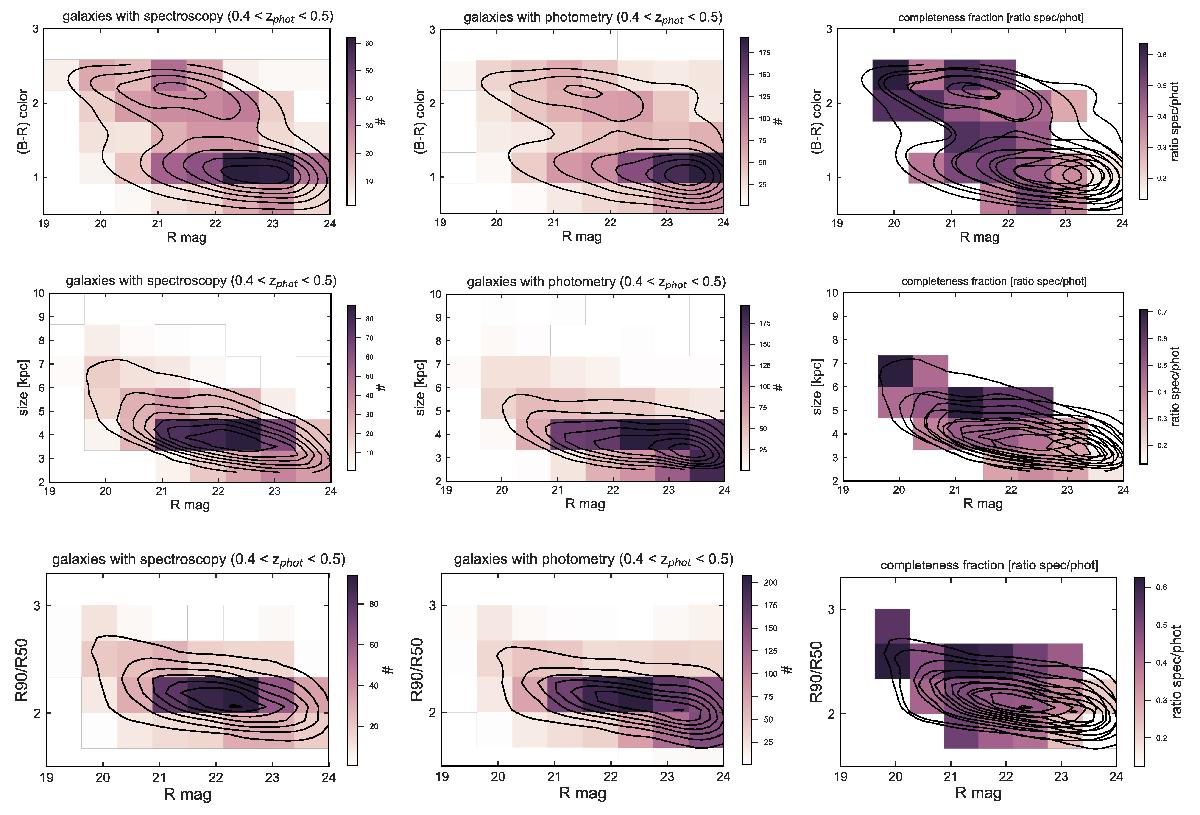
2D histograms of color (first row), size (second row), and concentration (third row) as a function of apparent magnitude. Black contours highlight their Gaussian kernel density estimation. The first column shows the distribution of galaxies in the photometric redshift range 0.4 <zphot< 0.5, calculated from Subaru SuprimeCam, and matched to the field-of-view of VIMOS. The middle column shows the same for galaxies with spectra. The right column demonstrates completeness fractions in bins with at least ten galaxies. The two samples hardly differ in the y direction. We correct for variations in the magnitudes with weights.
Current usage metrics show cumulative count of Article Views (full-text article views including HTML views, PDF and ePub downloads, according to the available data) and Abstracts Views on Vision4Press platform.
Data correspond to usage on the plateform after 2015. The current usage metrics is available 48-96 hours after online publication and is updated daily on week days.
Initial download of the metrics may take a while.