Fig. 11
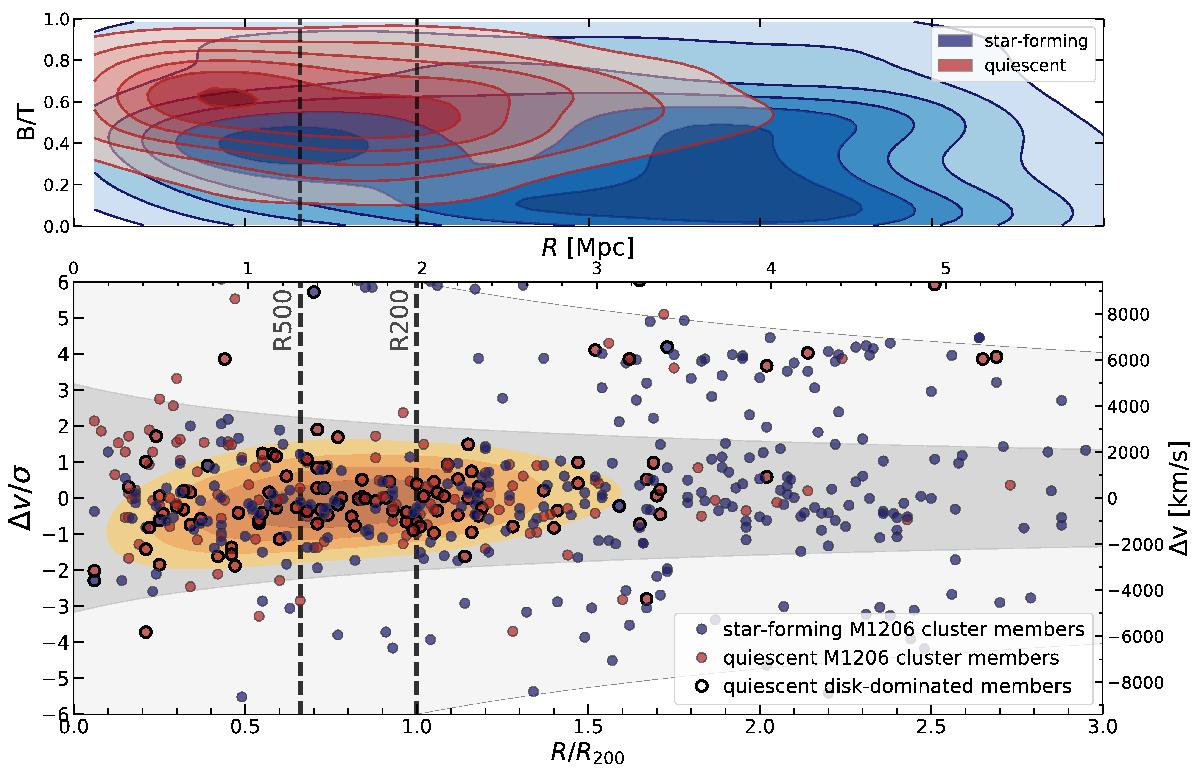
Bottom panel: distribution of galaxies in phase-space based on all spectroscopic members of MACS1206 used in this study. We plot radius versus velocity dispersion of star forming (blue) and quiescent (red) galaxies. Symbols with black edges show quiescent disk-dominated galaxies, that is, “red disks”. Their density distribution is highlighted with yellow shading, revealing their preferred location between R200 and R500. The dashed vertical line indicates R200 ~ 1.96 Mpc of the cluster (as reported in Biviano et al. 2013), and R500. Galaxies within the 2σ lines (inside the gray shaded area) are considered cluster members, while those between the 2 and 6σ lines are considered as infalling galaxies. Top panel: 2D distribution of all star forming and quiescent members estimated using Gaussian kernel density estimation (KDE). We show B/T as a function of cluster-centric radius, normalized by R200. The plot demonstrates the distribution of galaxies across the cluster according to their morphology (expressed in B/T): at greatest distances to the cluster center, we find star forming galaxies with a spread of lower B/T. Their B/T values increase inside 200. Finally, inside R500, quiescent galaxies with higher B/T values prevail.
Current usage metrics show cumulative count of Article Views (full-text article views including HTML views, PDF and ePub downloads, according to the available data) and Abstracts Views on Vision4Press platform.
Data correspond to usage on the plateform after 2015. The current usage metrics is available 48-96 hours after online publication and is updated daily on week days.
Initial download of the metrics may take a while.