Fig. 1
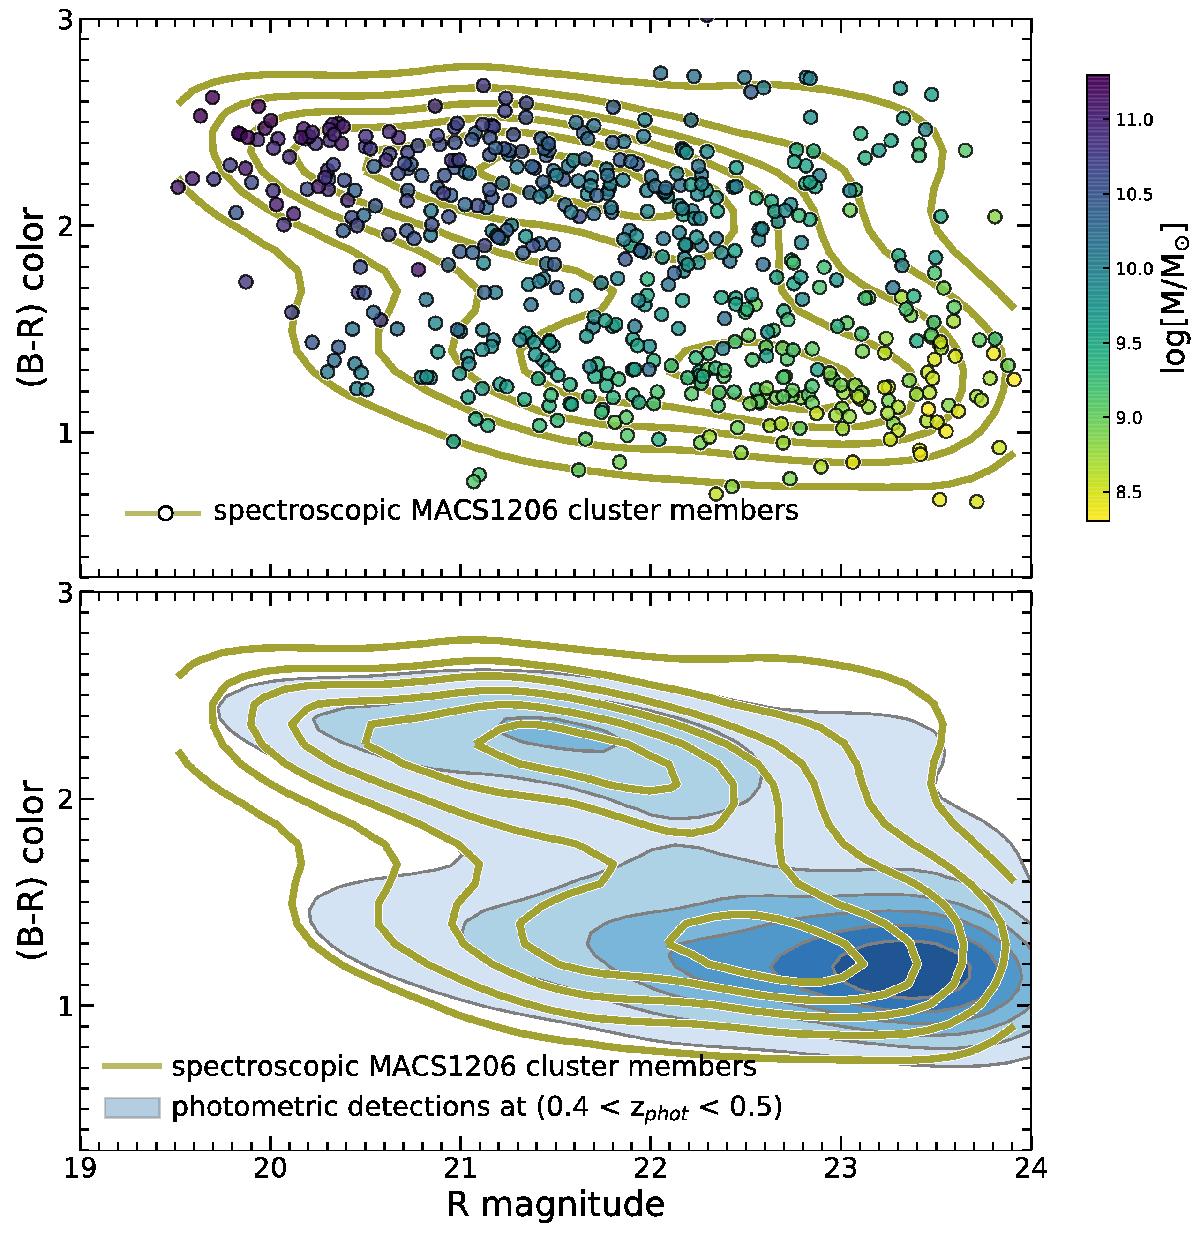
Observed color−magnitude relation of spectroscopic members of MACS1206. Each galaxy has been color-coded according to its mass. In the lower panel we contrast our sample (yellow density contours) to the color distribution of Subaru Suprime-Cam detections in the same field of view and at similar redshift range (blue filled density contours). This allows a rough visualization of completeness for our sample. We provide more detailed 2D completeness maps in the Appendix.
Current usage metrics show cumulative count of Article Views (full-text article views including HTML views, PDF and ePub downloads, according to the available data) and Abstracts Views on Vision4Press platform.
Data correspond to usage on the plateform after 2015. The current usage metrics is available 48-96 hours after online publication and is updated daily on week days.
Initial download of the metrics may take a while.