Fig. 7
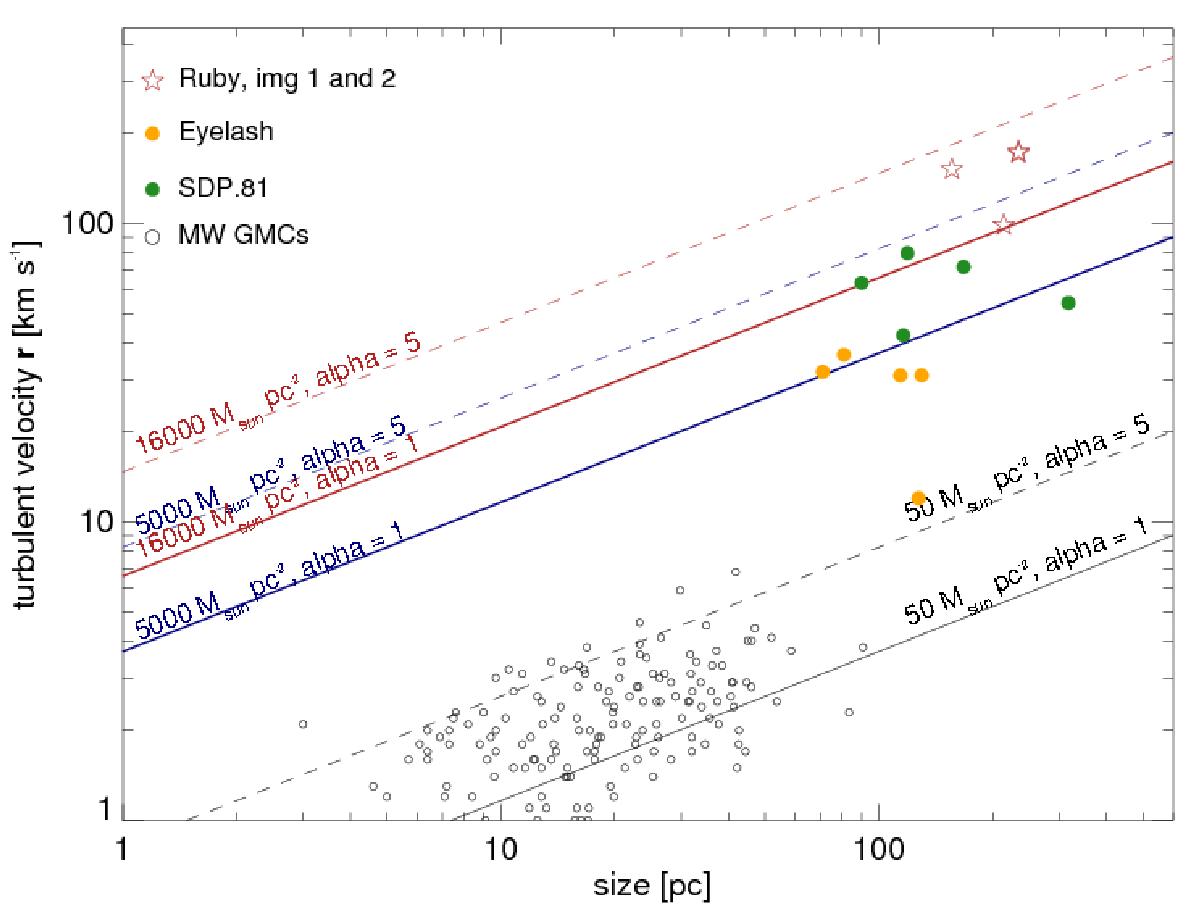
Turbulent scaling (“Larson”) relationship (Larson 1981) between gas velocity dispersion and cloud size in the source plane. Empty red stars show the sizes and line widths of the redshifted and blueshifted components seen in the Ruby within images #1 and #2, respectively. Green and yellow filled circles show similar observations of SDP.81 and the Eyelash from Swinbank et al. (2015) and Swinbank et al. (2011). Empty black circles show giant molecular clouds in the Milky Way. We also show expected line-width size relationships for gas mass surface densities, Σgas = 50M⊙ pc-2 characteristic for the Milky Way, and for 5000 M⊙ and 16 000M⊙ pc-2, which correspond to the lowest and highest values for the Ruby, respectively (Fig. 6). For each density we show the relationship for virial parameters αvir = 1 and 5, that is, clouds where turbulent energy either balances gravitational binding energy (solid line), or where it exceeds it by a factor 5 (dashed-dotted lines).
Current usage metrics show cumulative count of Article Views (full-text article views including HTML views, PDF and ePub downloads, according to the available data) and Abstracts Views on Vision4Press platform.
Data correspond to usage on the plateform after 2015. The current usage metrics is available 48-96 hours after online publication and is updated daily on week days.
Initial download of the metrics may take a while.