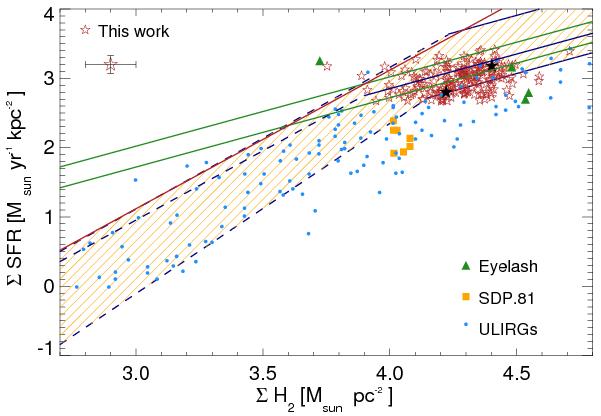
Fig. 6
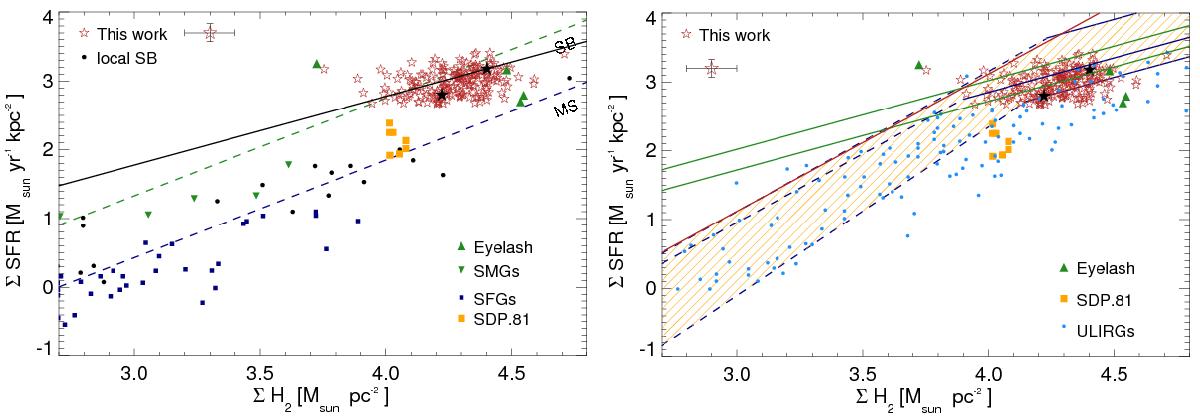
Left: spatially resolved Schmidt-Kennicutt law in PLCK G244.8+54.9 (red stars) and best fit relation (solid black line). The lower and upper black star indicate the luminosity-weighted average position of images #2.1 and #1.1, respectively. Other symbols indicate: submillimeter galaxies at z ~ 2 (green upside-down triangles, Bothwell et al. 2010), local starbursts (black circles, Kennicutt 1998), spatially-resolved data from the Eyelash (dark green triangles Swinbank et al. 2011) and SDP.81 (yellow squares, Hatsukade et al. 2015). The green and dark blue dashed lines indicate the Schmidt-Kennicutt relationship for high-z starburst galaxies and main sequence galaxies of Daddi et al. (2010), respectively. All star-formation rates are given for a Chabrier initial mass function, and are a factor 1.8 lower than in many other figures showing the Schmidt-Kennicutt relationship (see text for details). Right: same Schmidt-Kennicutt diagram, showing the position of maximum starbursts in several models, and the position of the Ruby relative to them. Light blue circles indicate nearby Eddington-limited starbursts (Andrews & Thompson 2011). The dark green solid lines show the mechanical input from stellar winds and supernova remnants for 100% and 50% efficiency, respectively. The dark blue lines and yellow hatched region show the models of Andrews & Thompson (2011) for an Eddington-limited starburst with a range of opacities between 10 and 30 cm2 g-1. Solid lines show the optically thick limit above the critical gas-mass surface density for the optically thick case, dashed lines the optically thin case below that limit. The solid blue line shows the relationship of Ostriker & Shetty (2011), also for optically thick and optically thin gas. The red line shows the model of Faucher-Giguère et al. (2013).
Current usage metrics show cumulative count of Article Views (full-text article views including HTML views, PDF and ePub downloads, according to the available data) and Abstracts Views on Vision4Press platform.
Data correspond to usage on the plateform after 2015. The current usage metrics is available 48-96 hours after online publication and is updated daily on week days.
Initial download of the metrics may take a while.