Fig. 2
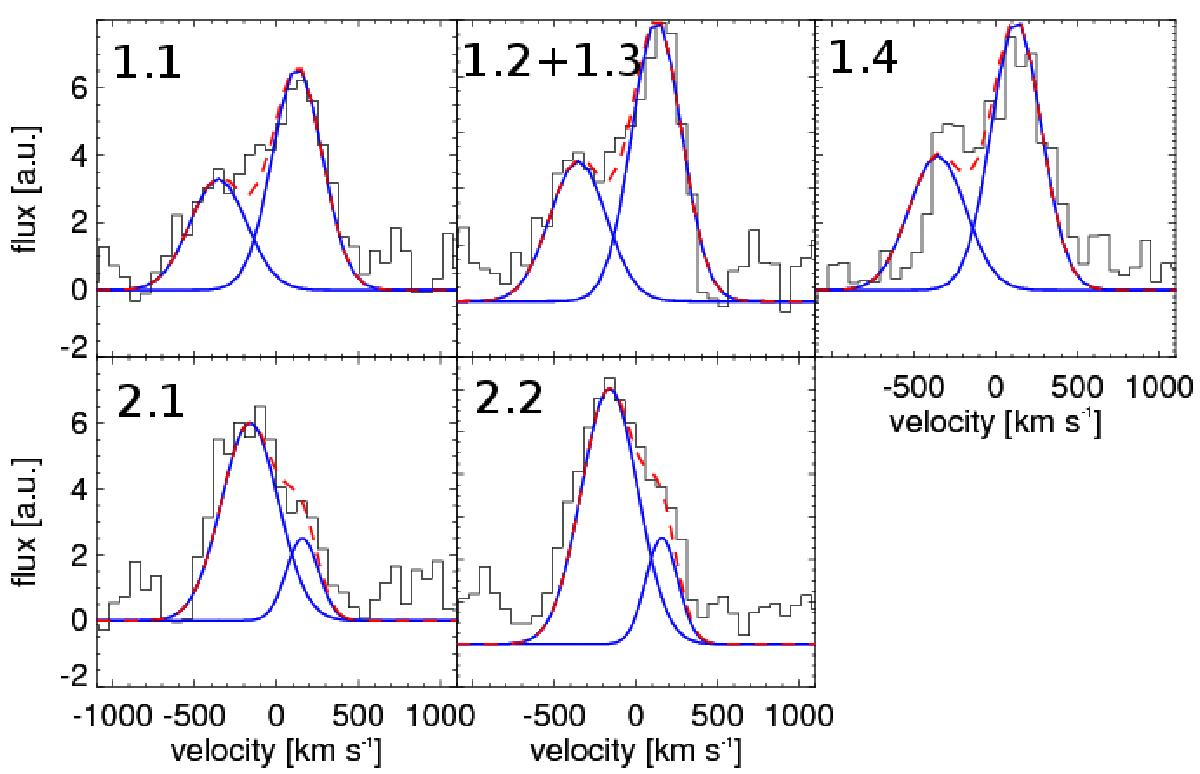
Spectra of individual counter images as assembled from clouds identified with Clumpfind, as labeled in Fig. 1. Images #1.2 and #1.3 are blended and identified as a single clump by Clumpfind. The dark blue and red lines show fits with Gaussian functions to the total line profile of each image system shown in Fig. 2, scaled to the total flux in each image. The mismatch between the blue component in image #1.4 can be explained with partial overlap with image #2.2.
Current usage metrics show cumulative count of Article Views (full-text article views including HTML views, PDF and ePub downloads, according to the available data) and Abstracts Views on Vision4Press platform.
Data correspond to usage on the plateform after 2015. The current usage metrics is available 48-96 hours after online publication and is updated daily on week days.
Initial download of the metrics may take a while.