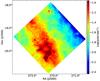
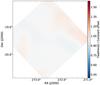
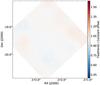
Fig. 3
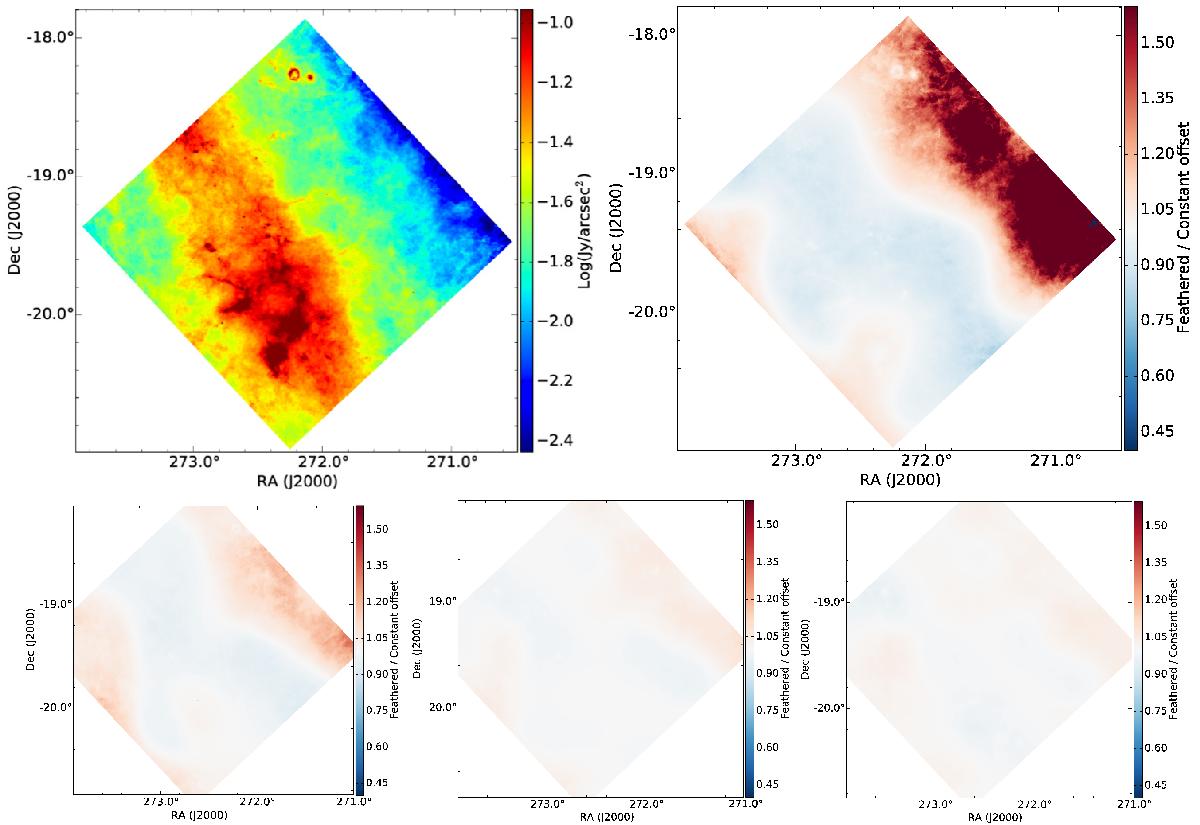
Top left: feathered 160 μm image of HiGal–11, shown on a log scale to highlight low emission regions at large scales where our method has the most impact. Top right: ratio of the feathered image over the constant-offset image. Bottom row: from left to right, same as in the top right panel for 250 μm, 350 μm, and 500 μm, showing the same colorbar in every case.
Current usage metrics show cumulative count of Article Views (full-text article views including HTML views, PDF and ePub downloads, according to the available data) and Abstracts Views on Vision4Press platform.
Data correspond to usage on the plateform after 2015. The current usage metrics is available 48-96 hours after online publication and is updated daily on week days.
Initial download of the metrics may take a while.