Free Access
Fig. 1
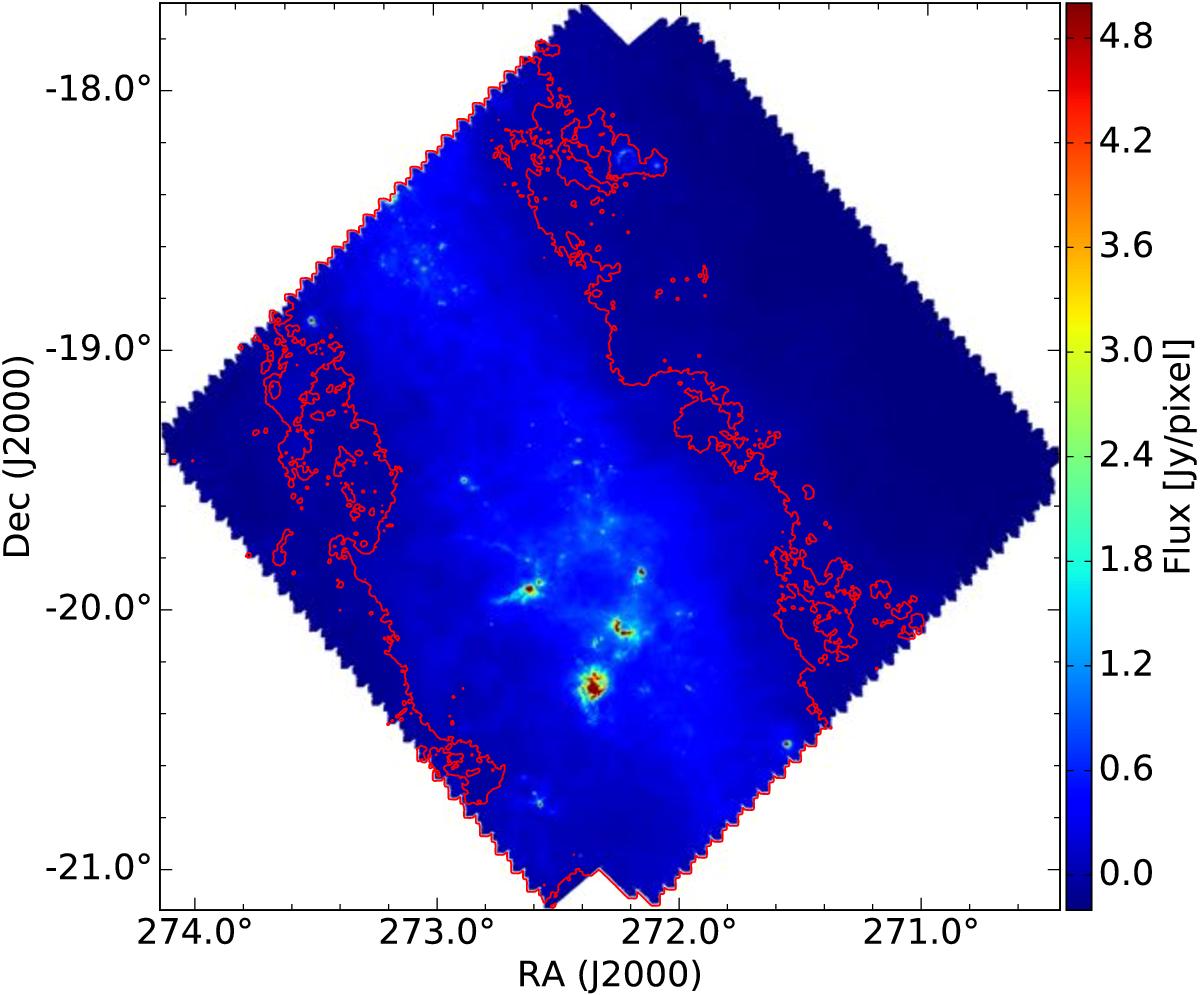
Herschel/PACS 160 μm map of HiGal–11. The red contour shows the region with negative fluxes in the Herschel map available in the Herschel data archive. This image also shows the “saw effect” in the map borders and the zero-pading (white edges surrounding the map).
Current usage metrics show cumulative count of Article Views (full-text article views including HTML views, PDF and ePub downloads, according to the available data) and Abstracts Views on Vision4Press platform.
Data correspond to usage on the plateform after 2015. The current usage metrics is available 48-96 hours after online publication and is updated daily on week days.
Initial download of the metrics may take a while.