Fig. 4
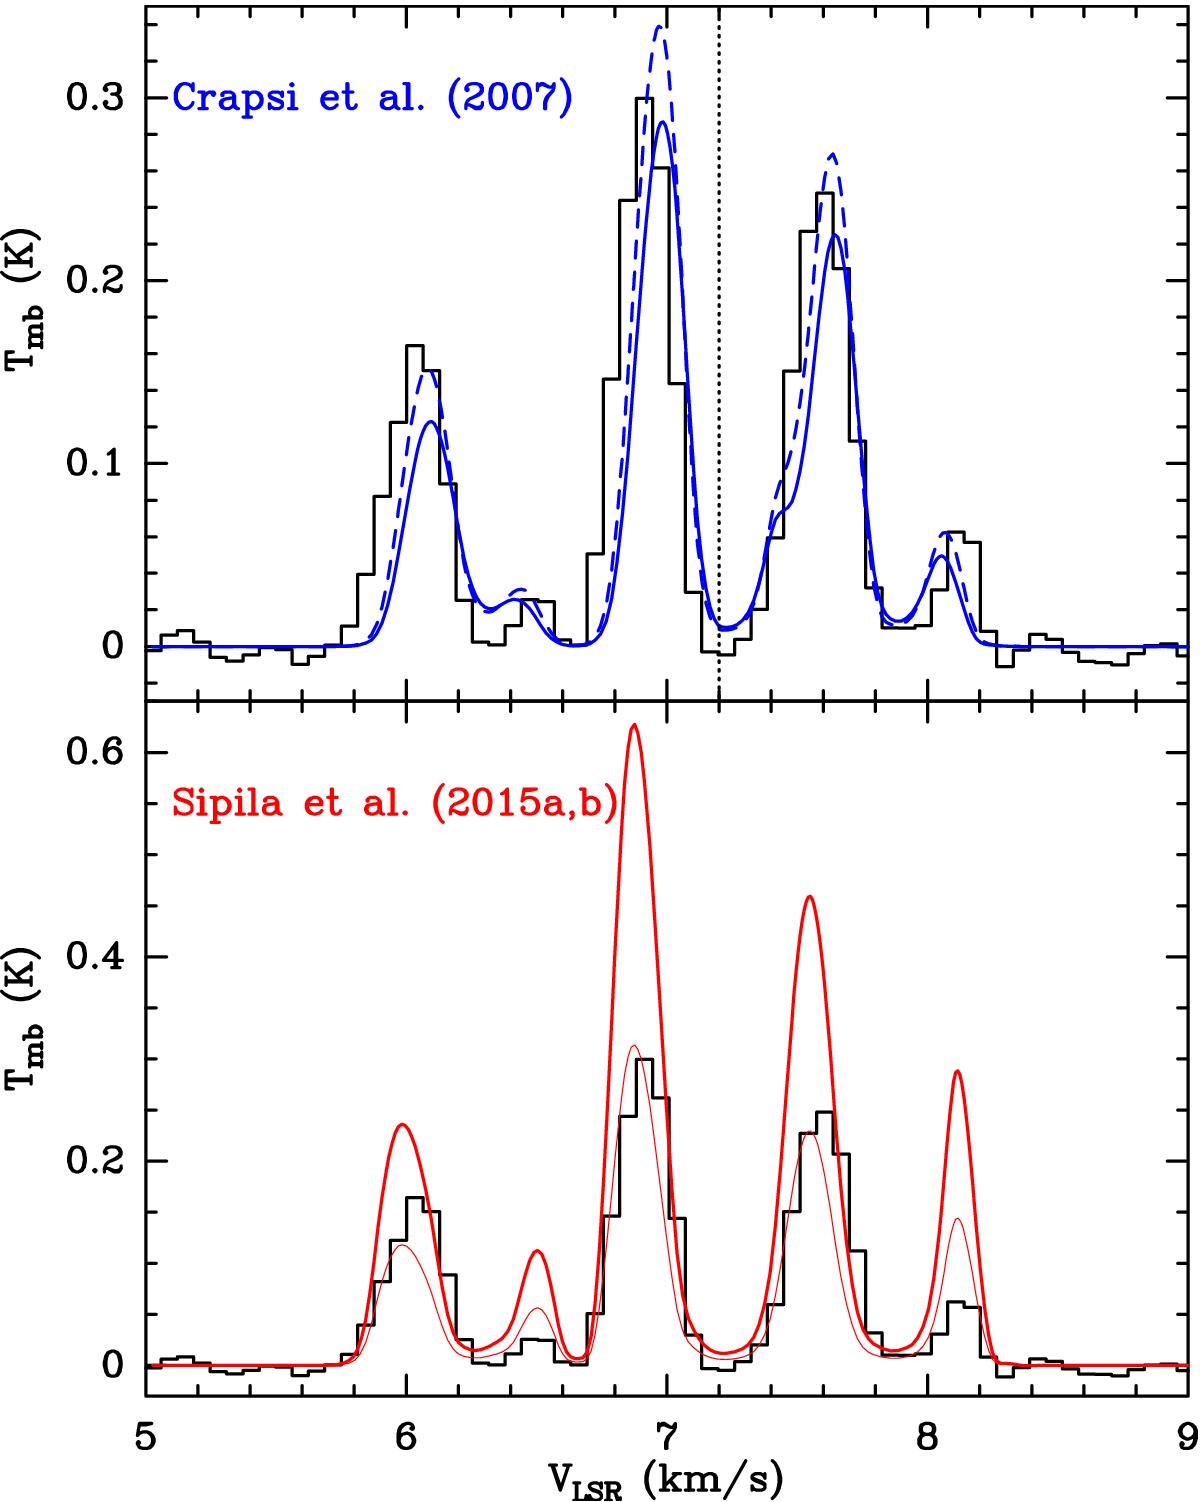
MOLLIE radiative transfer results using the o-NH3 fractional abundance profiles from Fig. 3, overlapped with the observed spectrum: (top) blue solid and dashed curves refer to the Crapsi et al. (2007) profiles, assuming an ortho-to-para NH3 ratio of 0.7 and 1.0, respectively. (Bottom) The red thick curve refers to the Sipilä et al. (2015a,b) profile; the red thin curve is the same as the thick red curve, but divided by 2.
Current usage metrics show cumulative count of Article Views (full-text article views including HTML views, PDF and ePub downloads, according to the available data) and Abstracts Views on Vision4Press platform.
Data correspond to usage on the plateform after 2015. The current usage metrics is available 48-96 hours after online publication and is updated daily on week days.
Initial download of the metrics may take a while.