Fig. 3
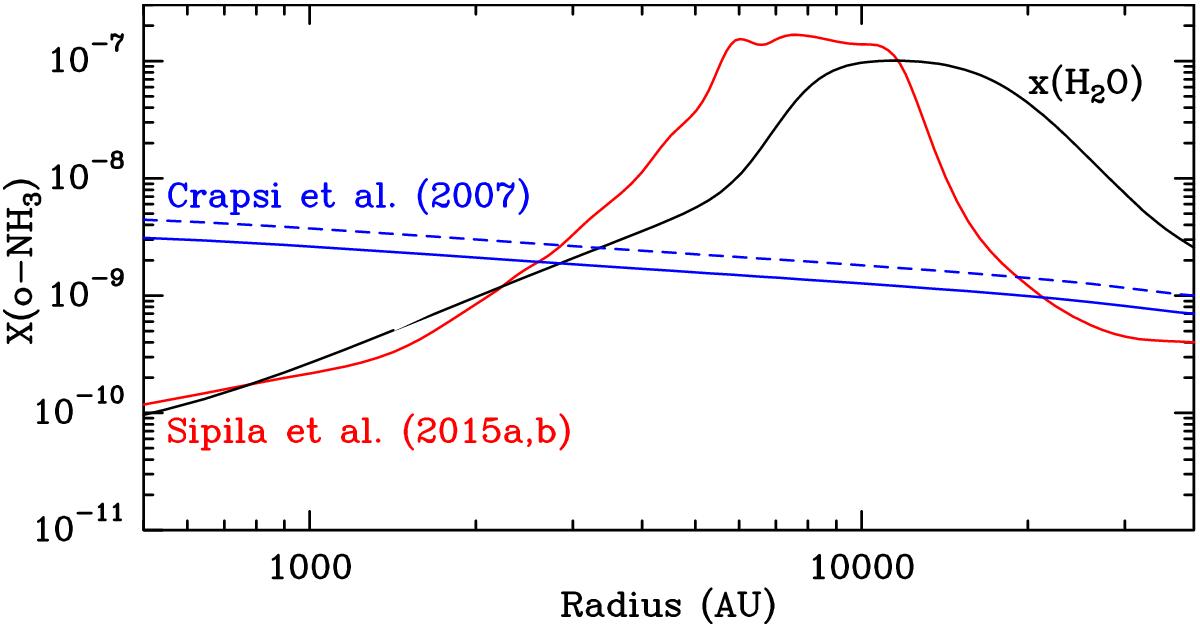
Radial profile of the fractional abundance of o-NH3 with respect to H2, X(o-NH3), in L1544. The blue profile has been deduced from observations carried out by Crapsi et al. (2007) assuming an ortho-to-para NH3 abundance ratio of 1 (dashed curve) and 0.7 (solid curve); the red profile is the result of a chemical model calculation by Sipilä et al. (2015a,b). The black profile refers to the total (ortho+para) abundance of H2O from Keto et al. (2014).
Current usage metrics show cumulative count of Article Views (full-text article views including HTML views, PDF and ePub downloads, according to the available data) and Abstracts Views on Vision4Press platform.
Data correspond to usage on the plateform after 2015. The current usage metrics is available 48-96 hours after online publication and is updated daily on week days.
Initial download of the metrics may take a while.