Fig. 2
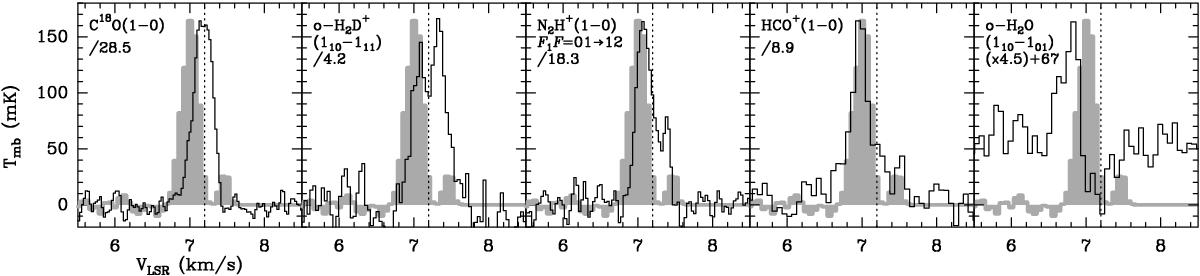
Comparison between the isolated hyperfine component ![]() of o-NH3(10 − 00) (filled grey histogram); for clarity, the NH3 spectrum has been cut above 7.8 km s-1 (6.6 km s-1 in the velocity scale of Fig. 1), where the other groups of hyperfine components are present and other molecular lines observed toward the same position: C18O(1−0), o-H2D+(110 − 111), N2H+(1−0), HCO+(1−0), and o-H2O(110 − 101) (thin histograms). To allow a clearer profile comparison, the C18O(1−0), o-H2D+(110 − 111), N2H+(1−0), and HCO+(1−0) spectra have been divided by the numbers shown below the transition in the top left corner of the panels. In the case of o-H2O(110 − 101) (last panel on the right), the spectrum has first been multiplied by 4.5 and then shifted by +67 mK. The comparison spectra are in order of increasing optical depth, from left to right. The vertical dotted line marks the core velocity.
of o-NH3(10 − 00) (filled grey histogram); for clarity, the NH3 spectrum has been cut above 7.8 km s-1 (6.6 km s-1 in the velocity scale of Fig. 1), where the other groups of hyperfine components are present and other molecular lines observed toward the same position: C18O(1−0), o-H2D+(110 − 111), N2H+(1−0), HCO+(1−0), and o-H2O(110 − 101) (thin histograms). To allow a clearer profile comparison, the C18O(1−0), o-H2D+(110 − 111), N2H+(1−0), and HCO+(1−0) spectra have been divided by the numbers shown below the transition in the top left corner of the panels. In the case of o-H2O(110 − 101) (last panel on the right), the spectrum has first been multiplied by 4.5 and then shifted by +67 mK. The comparison spectra are in order of increasing optical depth, from left to right. The vertical dotted line marks the core velocity.
Current usage metrics show cumulative count of Article Views (full-text article views including HTML views, PDF and ePub downloads, according to the available data) and Abstracts Views on Vision4Press platform.
Data correspond to usage on the plateform after 2015. The current usage metrics is available 48-96 hours after online publication and is updated daily on week days.
Initial download of the metrics may take a while.