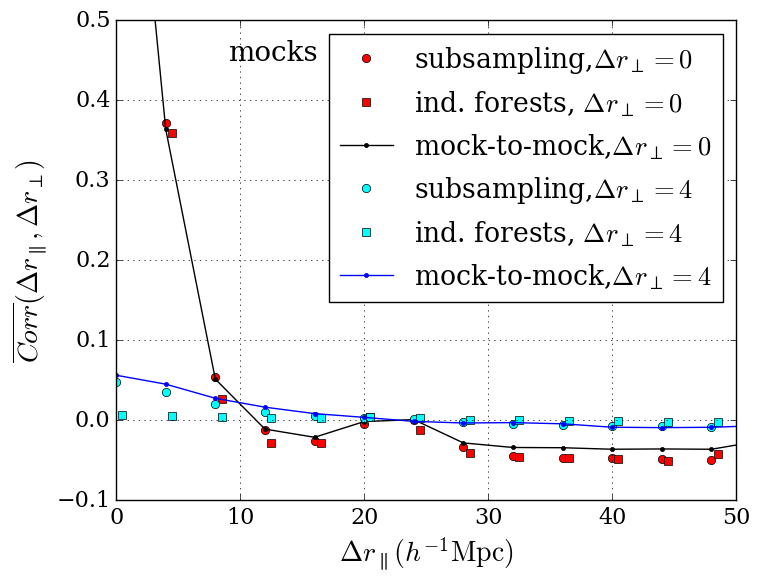
Fig. 7
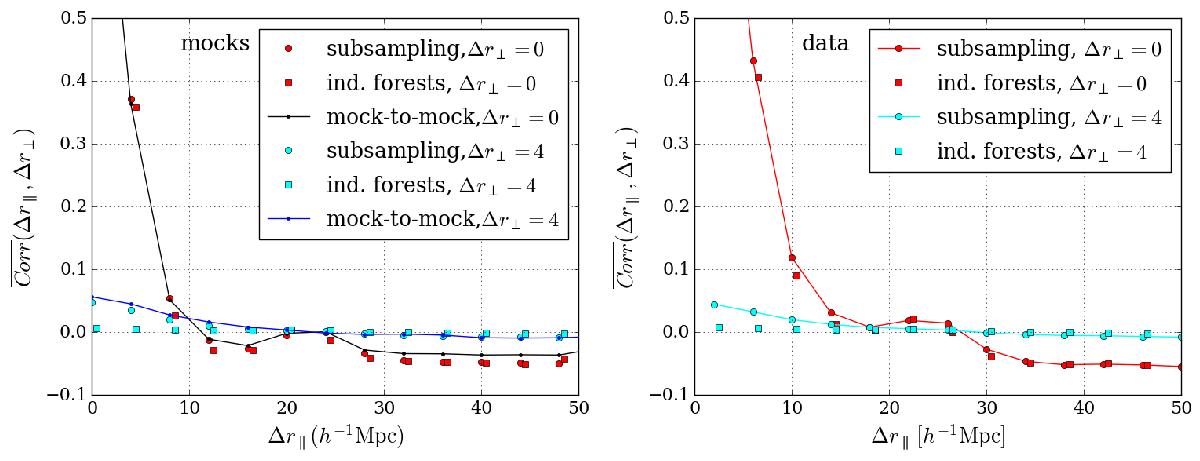
Correlation, Corr![]() , plotted vs.
, plotted vs. ![]() for the two lowest intervals of
for the two lowest intervals of ![]() . The correlation is averaged over
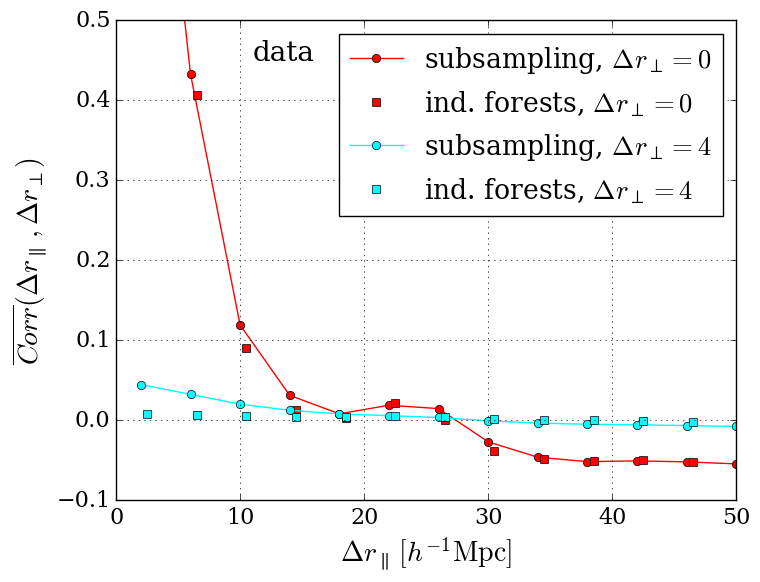
. The correlation is averaged over ![]() . The left panel is the Metal (Met1) mocks and the right panel is for the data. As labeled, the correlation is calculated by subsampling (Eq. (13)), by assuming “independent forests” (Eq. (14), offset by 0.5 h-1 Mpc for clarity), or by the mock-to-mock variation (Eq. (15)). Good agreement between the methods is seen, though the independent-forest method necessarily underestimates the correlation for Δr⊥ ≠ 0. The differences between the mocks and the data reflect the differences in ξ1d (Fig. 5).
. The left panel is the Metal (Met1) mocks and the right panel is for the data. As labeled, the correlation is calculated by subsampling (Eq. (13)), by assuming “independent forests” (Eq. (14), offset by 0.5 h-1 Mpc for clarity), or by the mock-to-mock variation (Eq. (15)). Good agreement between the methods is seen, though the independent-forest method necessarily underestimates the correlation for Δr⊥ ≠ 0. The differences between the mocks and the data reflect the differences in ξ1d (Fig. 5).
Current usage metrics show cumulative count of Article Views (full-text article views including HTML views, PDF and ePub downloads, according to the available data) and Abstracts Views on Vision4Press platform.
Data correspond to usage on the plateform after 2015. The current usage metrics is available 48-96 hours after online publication and is updated daily on week days.
Initial download of the metrics may take a while.