Fig. 5
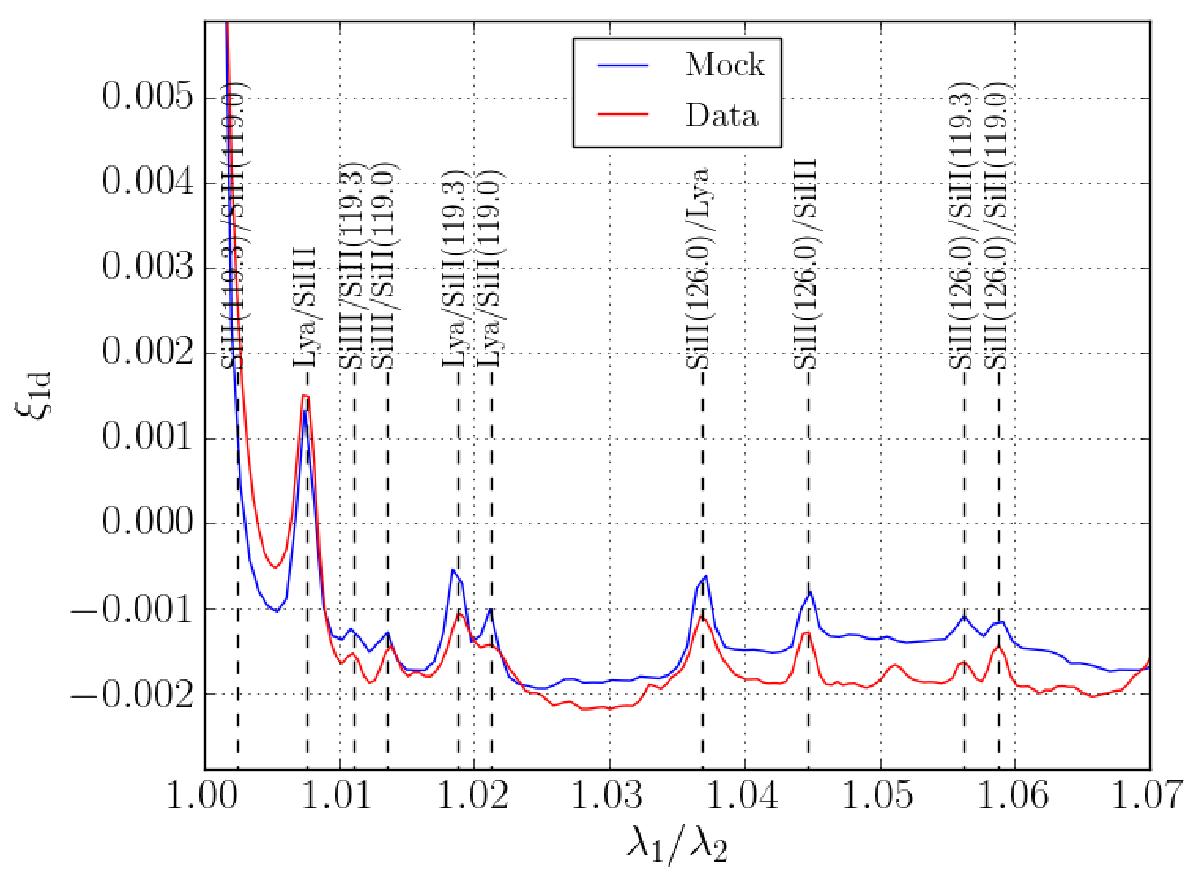
One-dimensional flux-correlation function, ξ1d, for BOSS quasars showing correlations of δq(λ) within the same forest. The correlation function is shown as a function of wavelength ratio for the data and for the mocks (procedure Met1). Prominent peaks due to Lyα-metal and metal-metal correlations are indicated. The peak at λ1/λ2 ~ 1.051, which is seen in the data but not in the mocks, is due to CII(133.5)-SiIV(140.277) at z ~ 1.85, outside the redshift range covered by the mocks.
Current usage metrics show cumulative count of Article Views (full-text article views including HTML views, PDF and ePub downloads, according to the available data) and Abstracts Views on Vision4Press platform.
Data correspond to usage on the plateform after 2015. The current usage metrics is available 48-96 hours after online publication and is updated daily on week days.
Initial download of the metrics may take a while.