Fig. 4
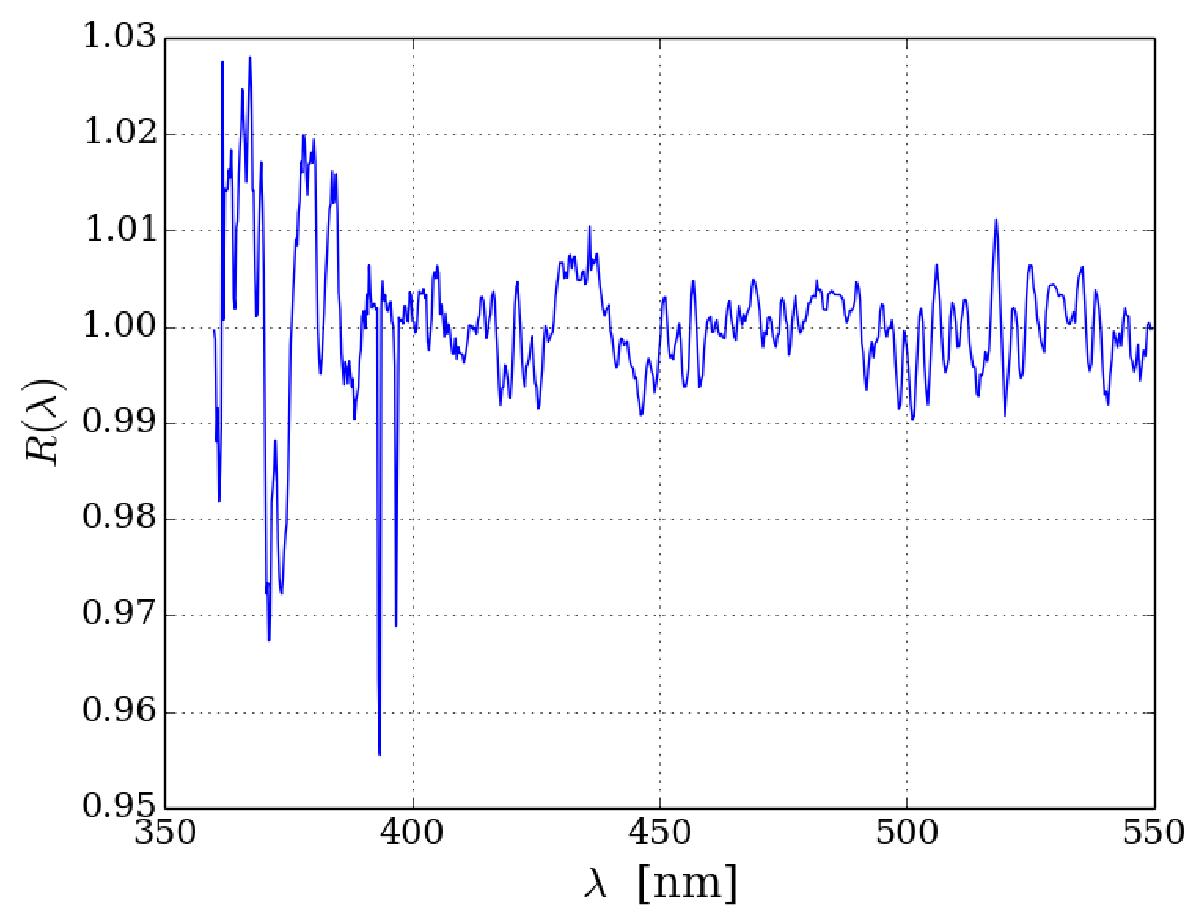
Mean ratio, R(λ), of observed flux to pipeline-model flux as a function of observed wavelength for quasar spectra to the red of the Lyα emission line (λRF> 130 nm). (The mean is calculated by weighting each measurement by the inverse of the pipeline variance.) In this mostly unabsorbed region of quasar spectra, the percent-level wavelength-dependent deviations from unity are due to imperfect modeling of calibration stars and to the calcium H and K lines (393.4 and 396.9 nm) due to Galactic absorption.
Current usage metrics show cumulative count of Article Views (full-text article views including HTML views, PDF and ePub downloads, according to the available data) and Abstracts Views on Vision4Press platform.
Data correspond to usage on the plateform after 2015. The current usage metrics is available 48-96 hours after online publication and is updated daily on week days.
Initial download of the metrics may take a while.