Fig. A.1
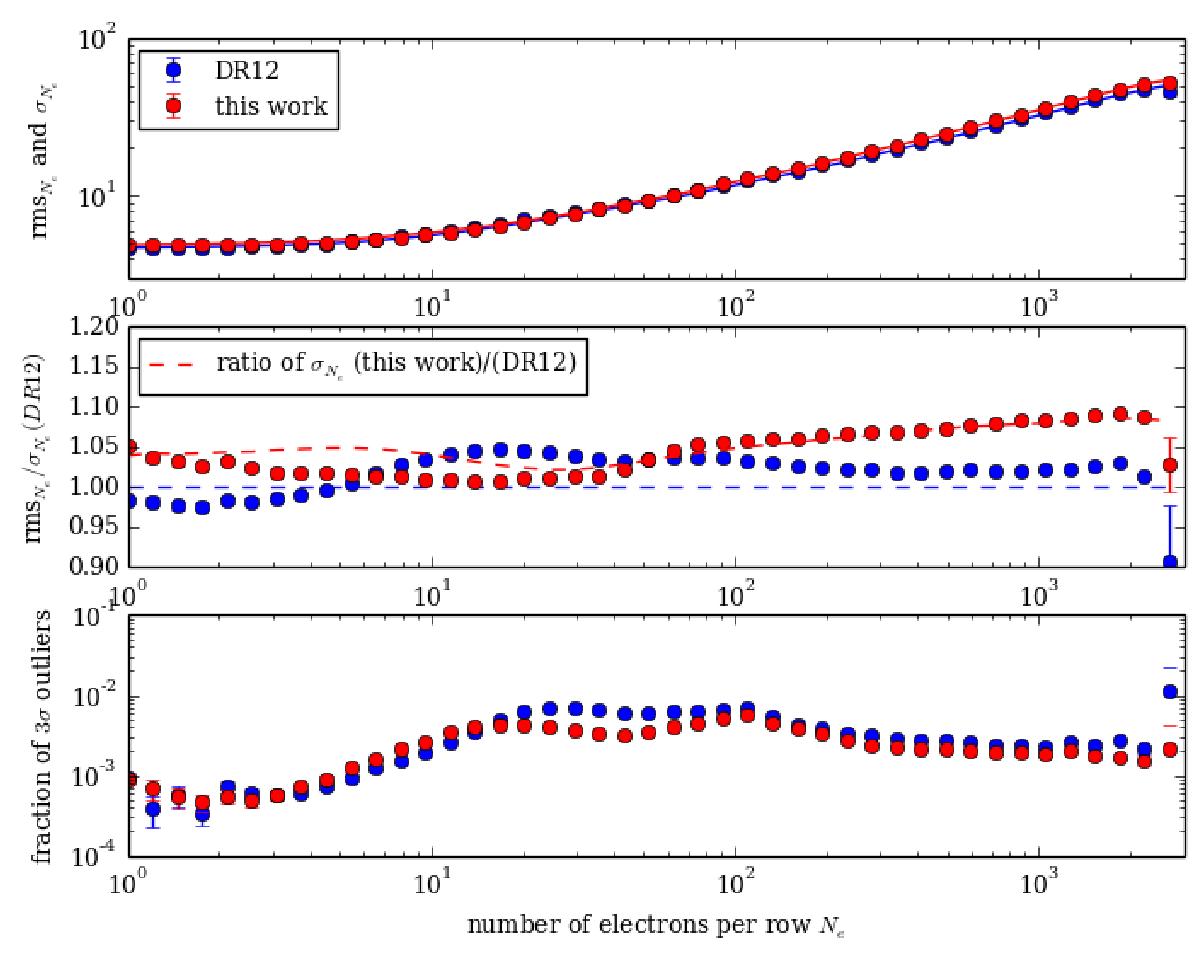
Comparison of flux measurement uncertainties between the DR12 data reduction (in blue) and this new extraction (in red). This analysis is based on the data from camera b1, plate 7339, where many observations of the same targets were performed. The top panel shows the empirical rms (circles) among the various observations, and the corresponding predicted uncertainty (lines) of the number of electrons per CCD row (Ne) as a function of Ne. The second panel is the same quantity normalized by the predicted uncertainty of DR12. The bottom panel displays the fraction of 3σ outliers that were discarded in the two other panels. As expected, there is a larger dispersion with the new, less optimal reduction at high flux. The larger dispersion at low flux is not easy to understand; it is probably a consequence of the biased estimator in DR12, where negative statistical fluctuations are given a high weight.
Current usage metrics show cumulative count of Article Views (full-text article views including HTML views, PDF and ePub downloads, according to the available data) and Abstracts Views on Vision4Press platform.
Data correspond to usage on the plateform after 2015. The current usage metrics is available 48-96 hours after online publication and is updated daily on week days.
Initial download of the metrics may take a while.