Fig. 15
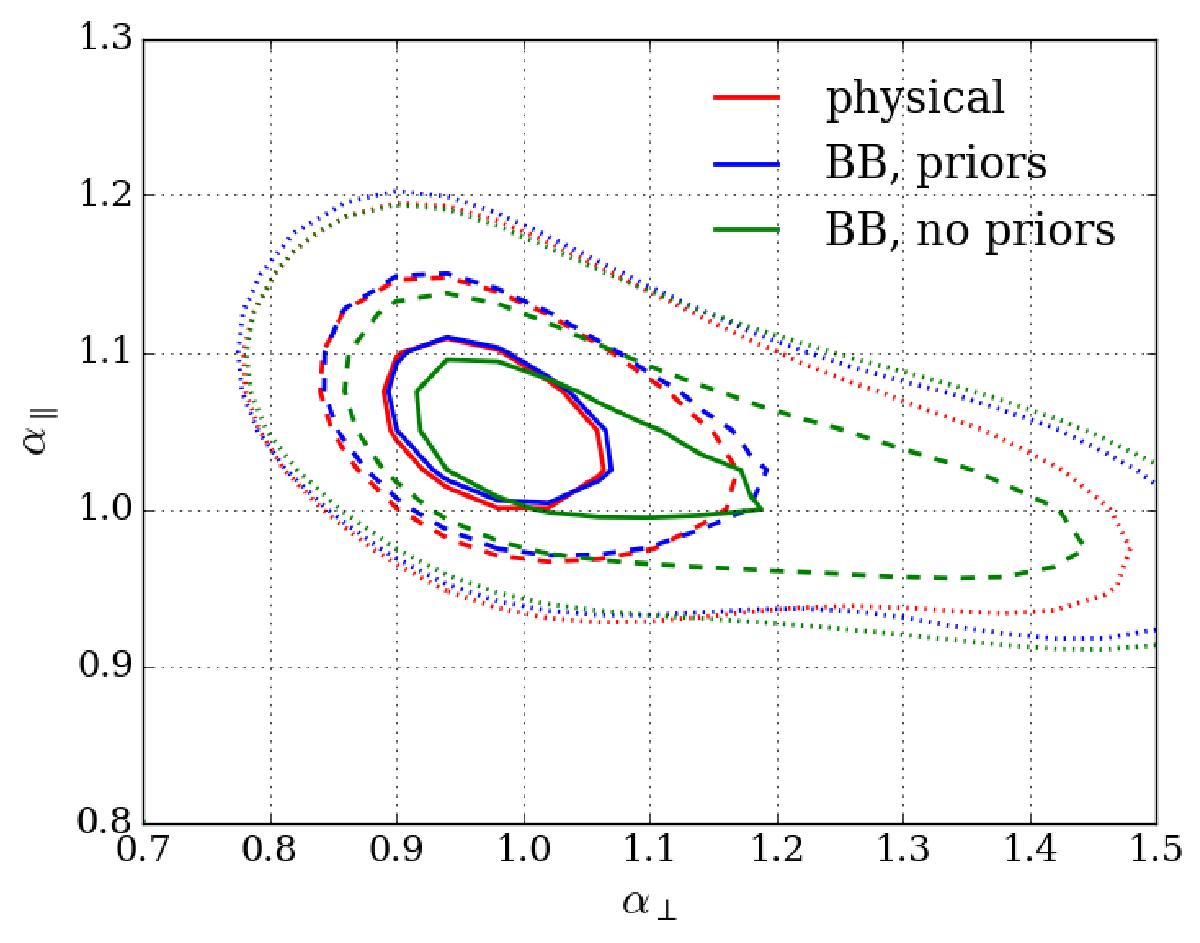
Contours for (α⊥,α∥) at the (68.3, 95.45, 99.73)% CL (solid, dashed, dotted). The red contours are for the physical model with HCDs and UV fluctuations from Tables 3 and 5. The blue (green) contours are for the (imin,imax,jmax) = (0,2,6) power-law broadband with (without) priors on the parameters of the physical correlation function.
Current usage metrics show cumulative count of Article Views (full-text article views including HTML views, PDF and ePub downloads, according to the available data) and Abstracts Views on Vision4Press platform.
Data correspond to usage on the plateform after 2015. The current usage metrics is available 48-96 hours after online publication and is updated daily on week days.
Initial download of the metrics may take a while.