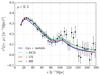
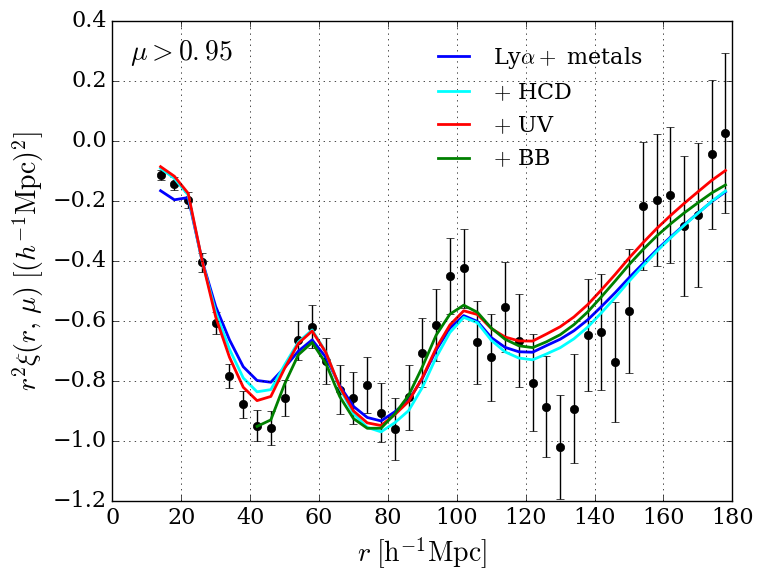
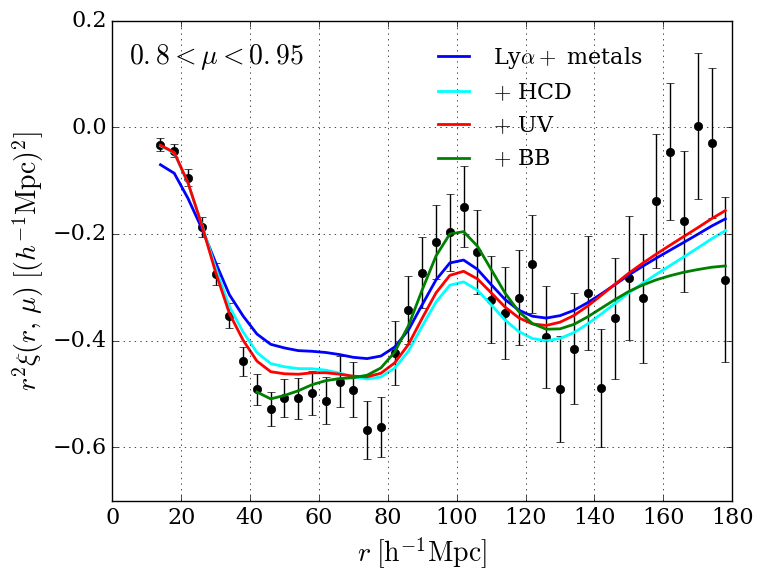
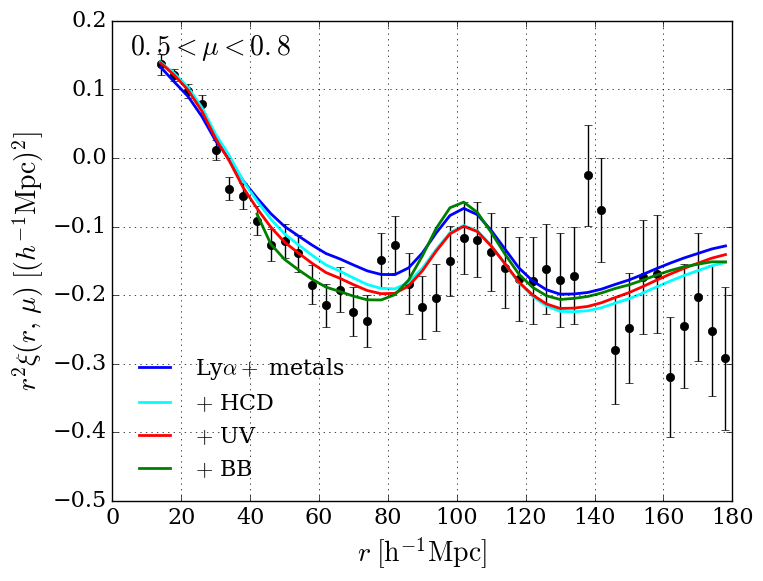
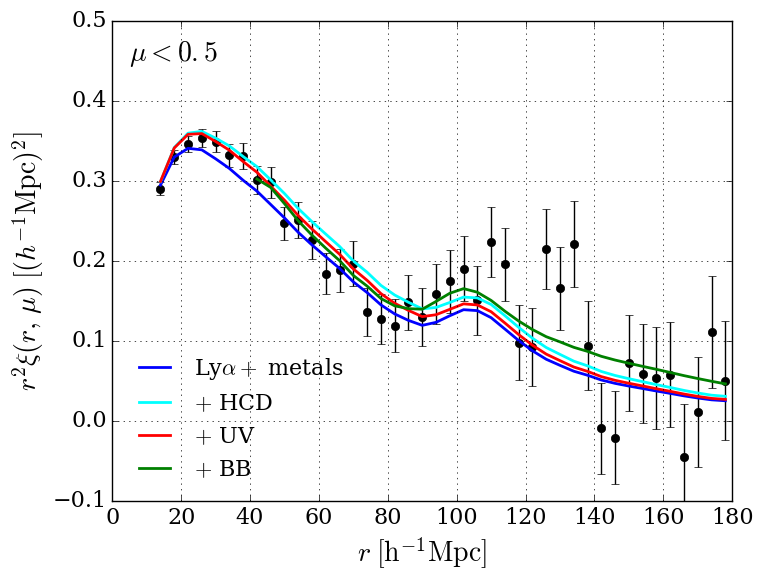
Fig. 14
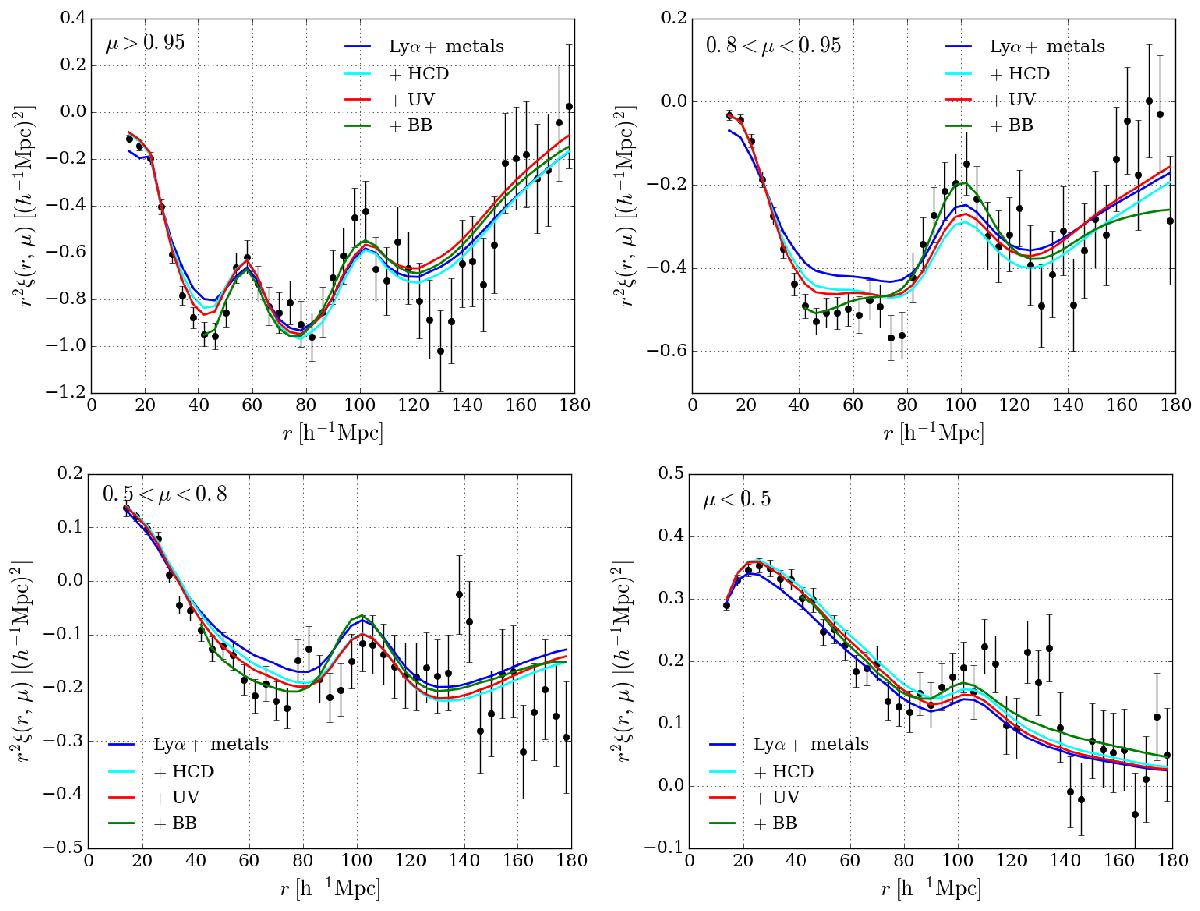
Measured correlation function in four ranges of μ. The most radial range (top-left μ> 0.95) has, in addition to the BAO peak at ~100 h-1 Mpc, a peak at ~60 h-1 Mpc due to correlated absorption by Lyα and SiIII(119.0,119.3) at the same physical position. In the next radial bin (top-right, 0.8 <μ< 0.95) only the BAO peak is visible. The lines show fits including successively Lyα and metal absorption, unidentified HCDs absorption, UV flux fluctuations, and a (imin,imax,jmax) = (0,2,6) broadband (BB).
Current usage metrics show cumulative count of Article Views (full-text article views including HTML views, PDF and ePub downloads, according to the available data) and Abstracts Views on Vision4Press platform.
Data correspond to usage on the plateform after 2015. The current usage metrics is available 48-96 hours after online publication and is updated daily on week days.
Initial download of the metrics may take a while.