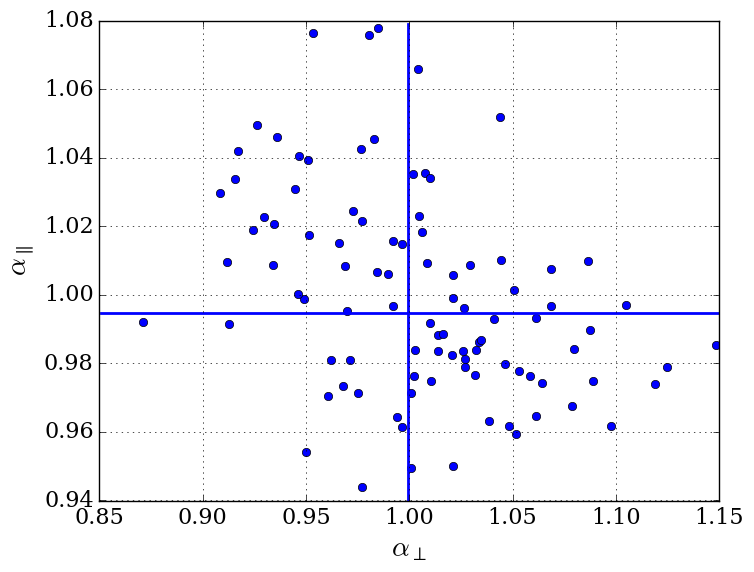
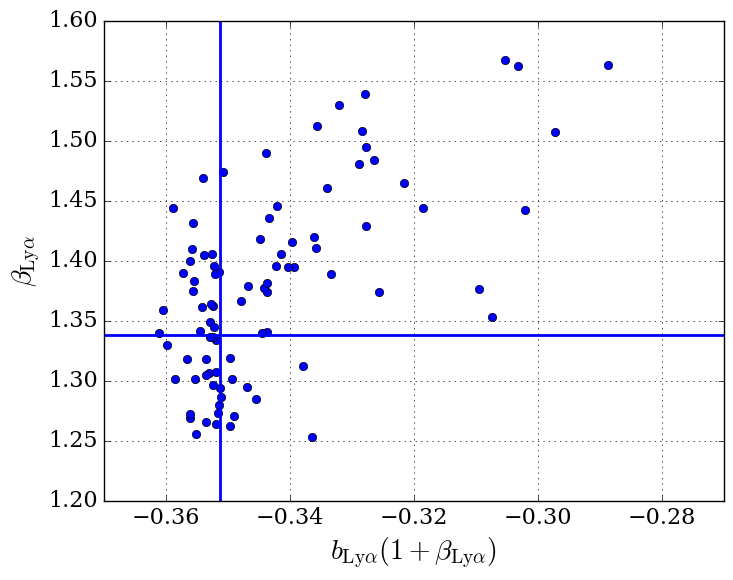
Fig. 13
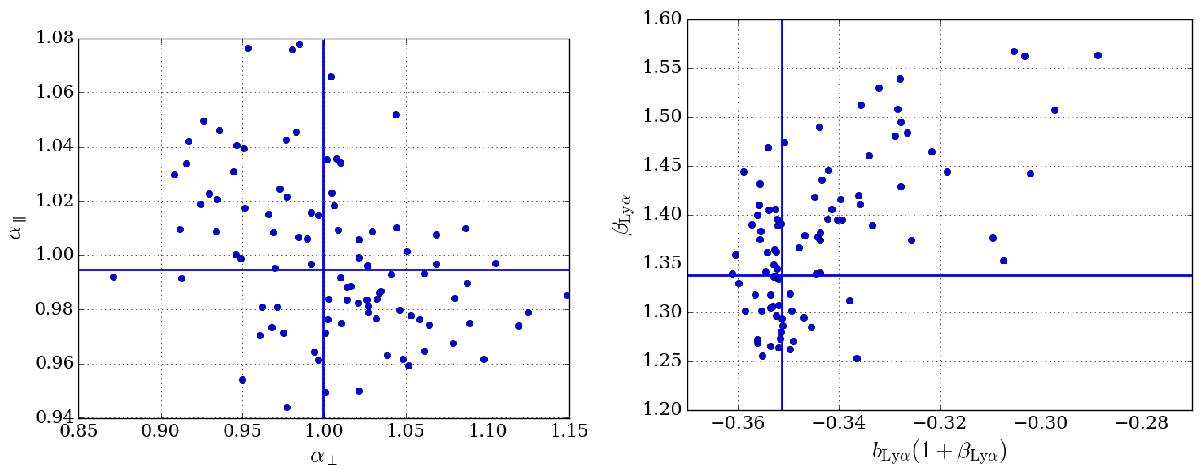
Measured α⊥ and α∥ (left) and βLyα and bLyα(1 + βLyα) (right) for the 100 mock catalogs including HCDs with NHI> 1020 cm2 masked. There are four outliers on the left plot and two on the right. The horizontal and vertical blue lines show the weighted means of the distributions, also given in Table 4. The distribution and mean values of (α⊥,α∥) indicates no significant bias in the reconstruction of the BAO peak-position parameters.
Current usage metrics show cumulative count of Article Views (full-text article views including HTML views, PDF and ePub downloads, according to the available data) and Abstracts Views on Vision4Press platform.
Data correspond to usage on the plateform after 2015. The current usage metrics is available 48-96 hours after online publication and is updated daily on week days.
Initial download of the metrics may take a while.