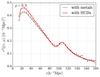
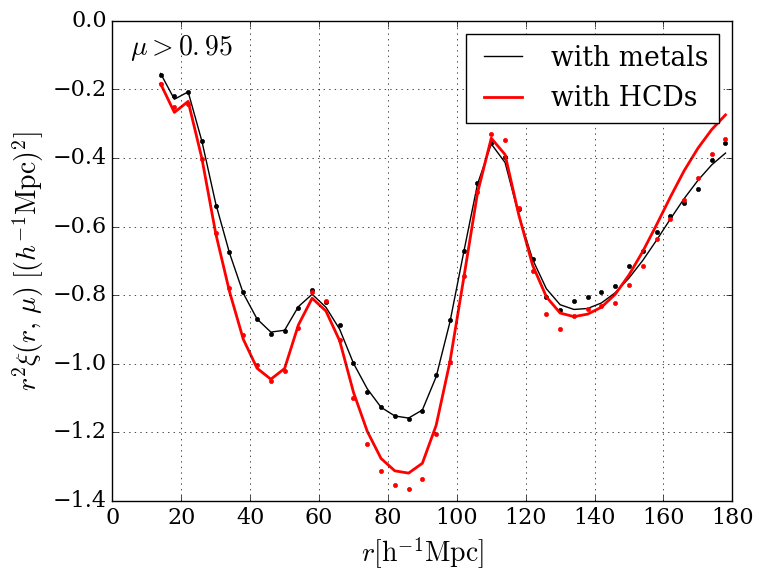
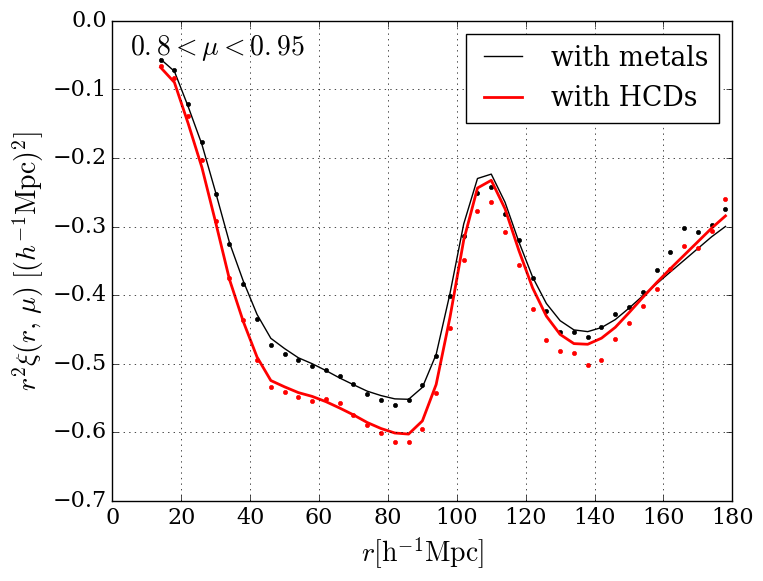
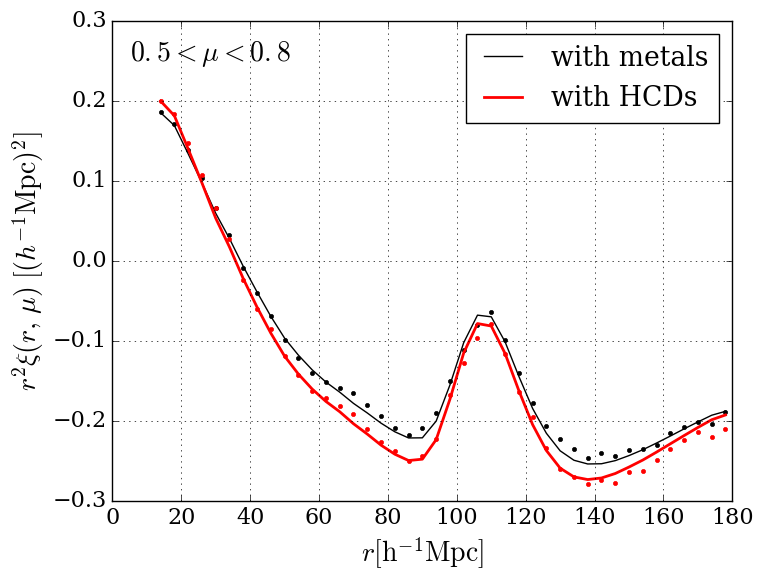
Fig. 12
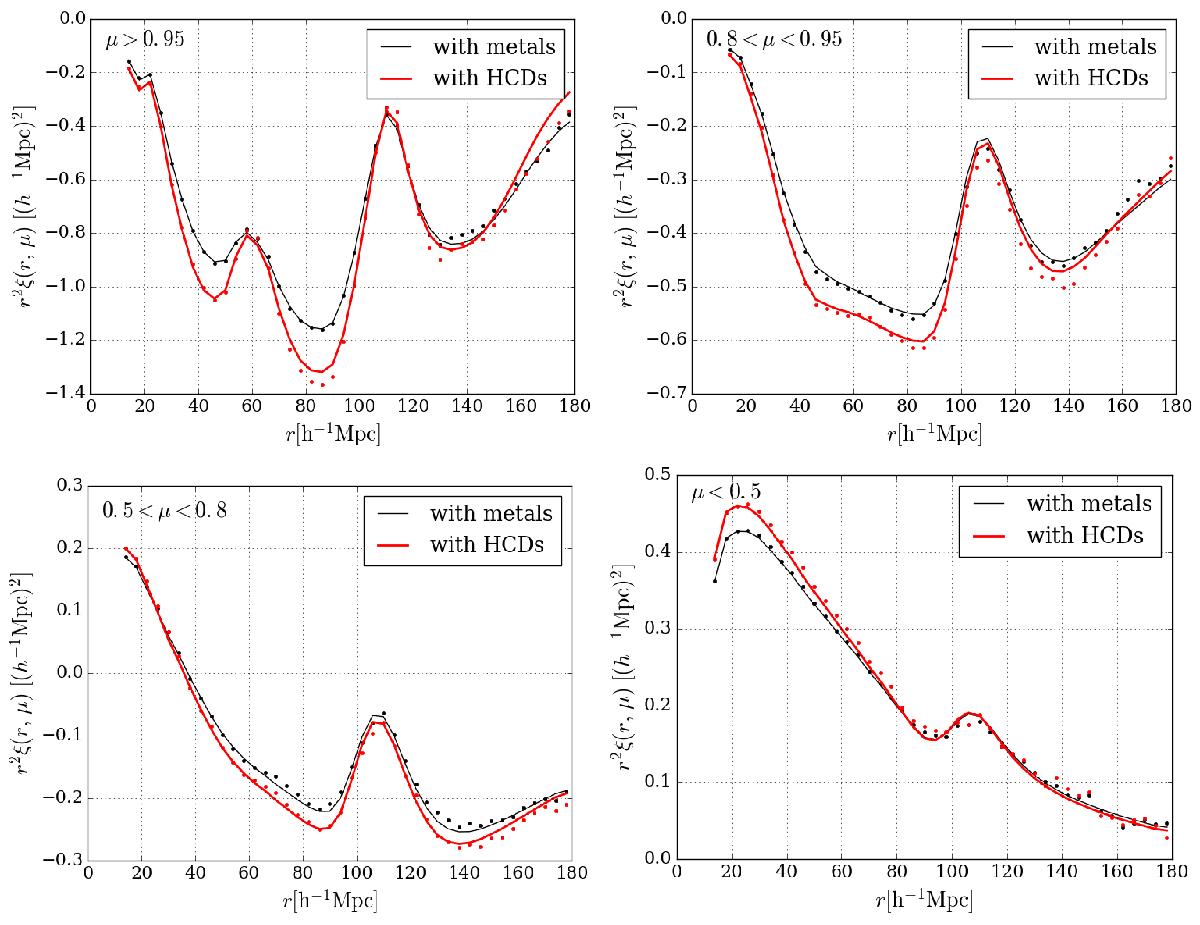
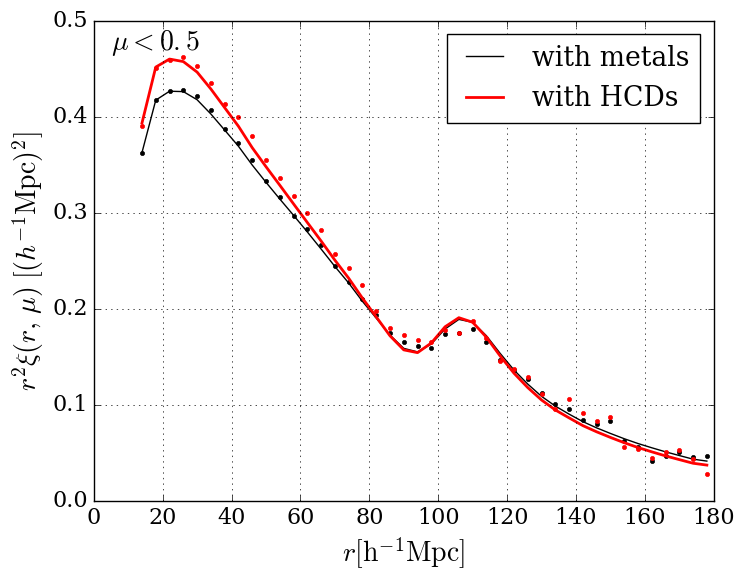
Correlation function for the stack of the 100 mocks in four ranges of μ. The red points represent the measured correlation function of the mocks with metals and the red curves shows the best fit. The black points indicate the correlation function after including, in addition to metals, HCDs unmasked for NHI< 1020 cm-2 and the black curve the best fit. The peak at r ~ 60 h-1 Mpc due to SiIIa and SiIIb is apparent in the range μ> 0.95 but not in the range 0.8 <μ< 0.95.
Current usage metrics show cumulative count of Article Views (full-text article views including HTML views, PDF and ePub downloads, according to the available data) and Abstracts Views on Vision4Press platform.
Data correspond to usage on the plateform after 2015. The current usage metrics is available 48-96 hours after online publication and is updated daily on week days.
Initial download of the metrics may take a while.