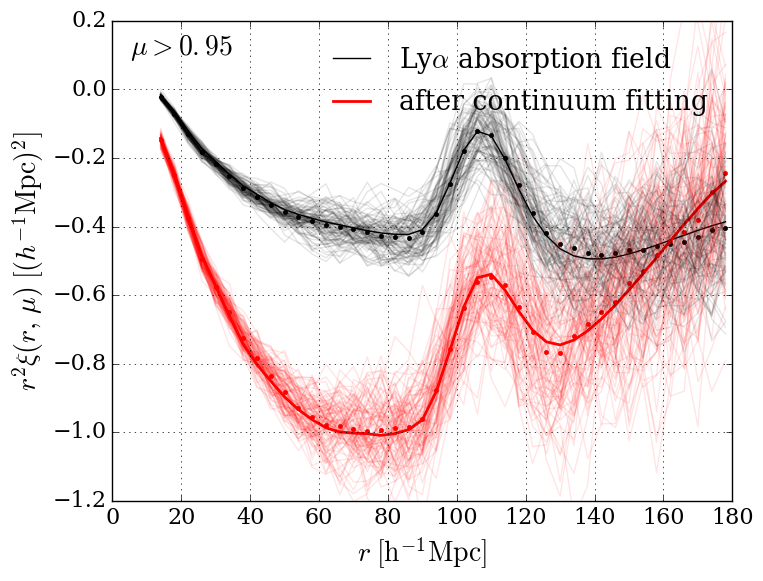
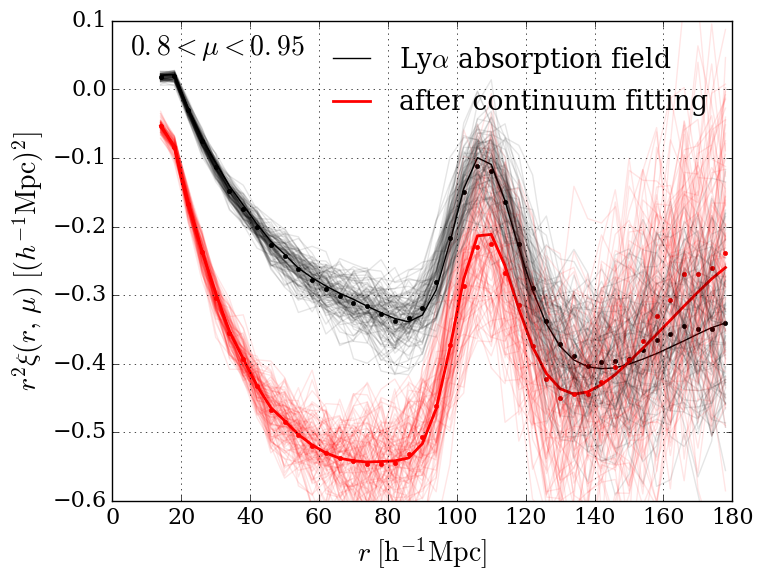
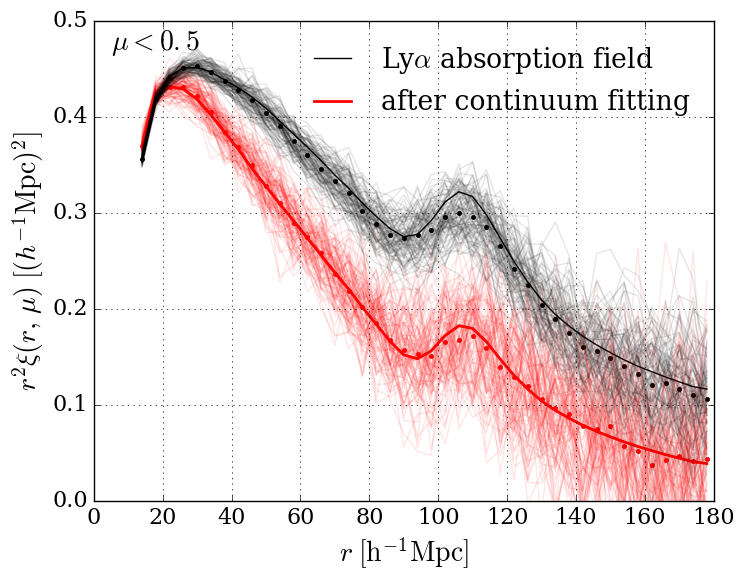
Fig. 11
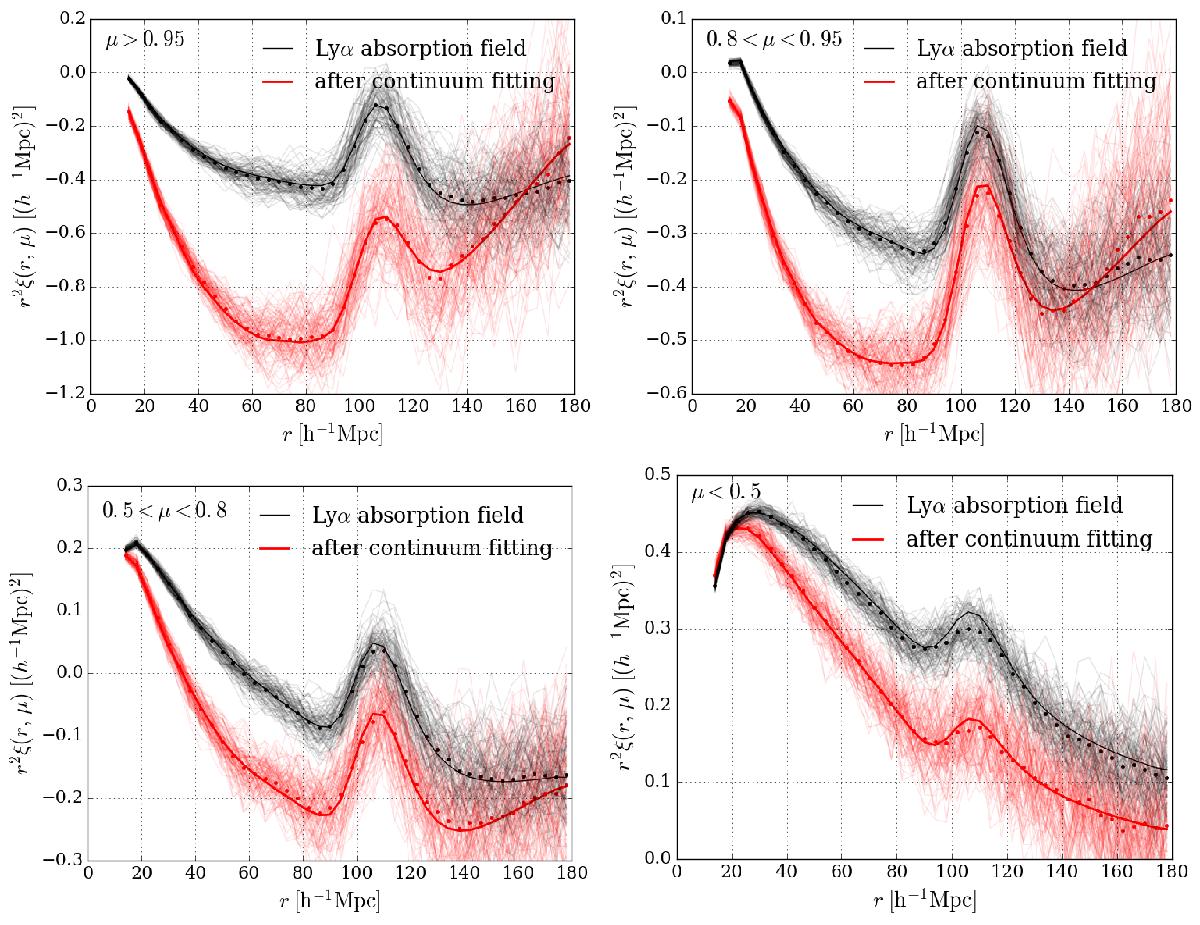
Correlation function for the metal-free mocks in four ranges of μ. The black points and curves correspond to mocks with Lyα absorption but without the addition of a quasar continuum. The red points and curves correspond to mocks with the addition of a continuum. The points correspond to stacks of 100 mocks and the light curves to individual mocks. The heavy curves correspond to the input model of Table 1 (after distortion by the matrix DAA′ (Eq. (10)) for the red curve).


Current usage metrics show cumulative count of Article Views (full-text article views including HTML views, PDF and ePub downloads, according to the available data) and Abstracts Views on Vision4Press platform.
Data correspond to usage on the plateform after 2015. The current usage metrics is available 48-96 hours after online publication and is updated daily on week days.
Initial download of the metrics may take a while.