Fig. 8
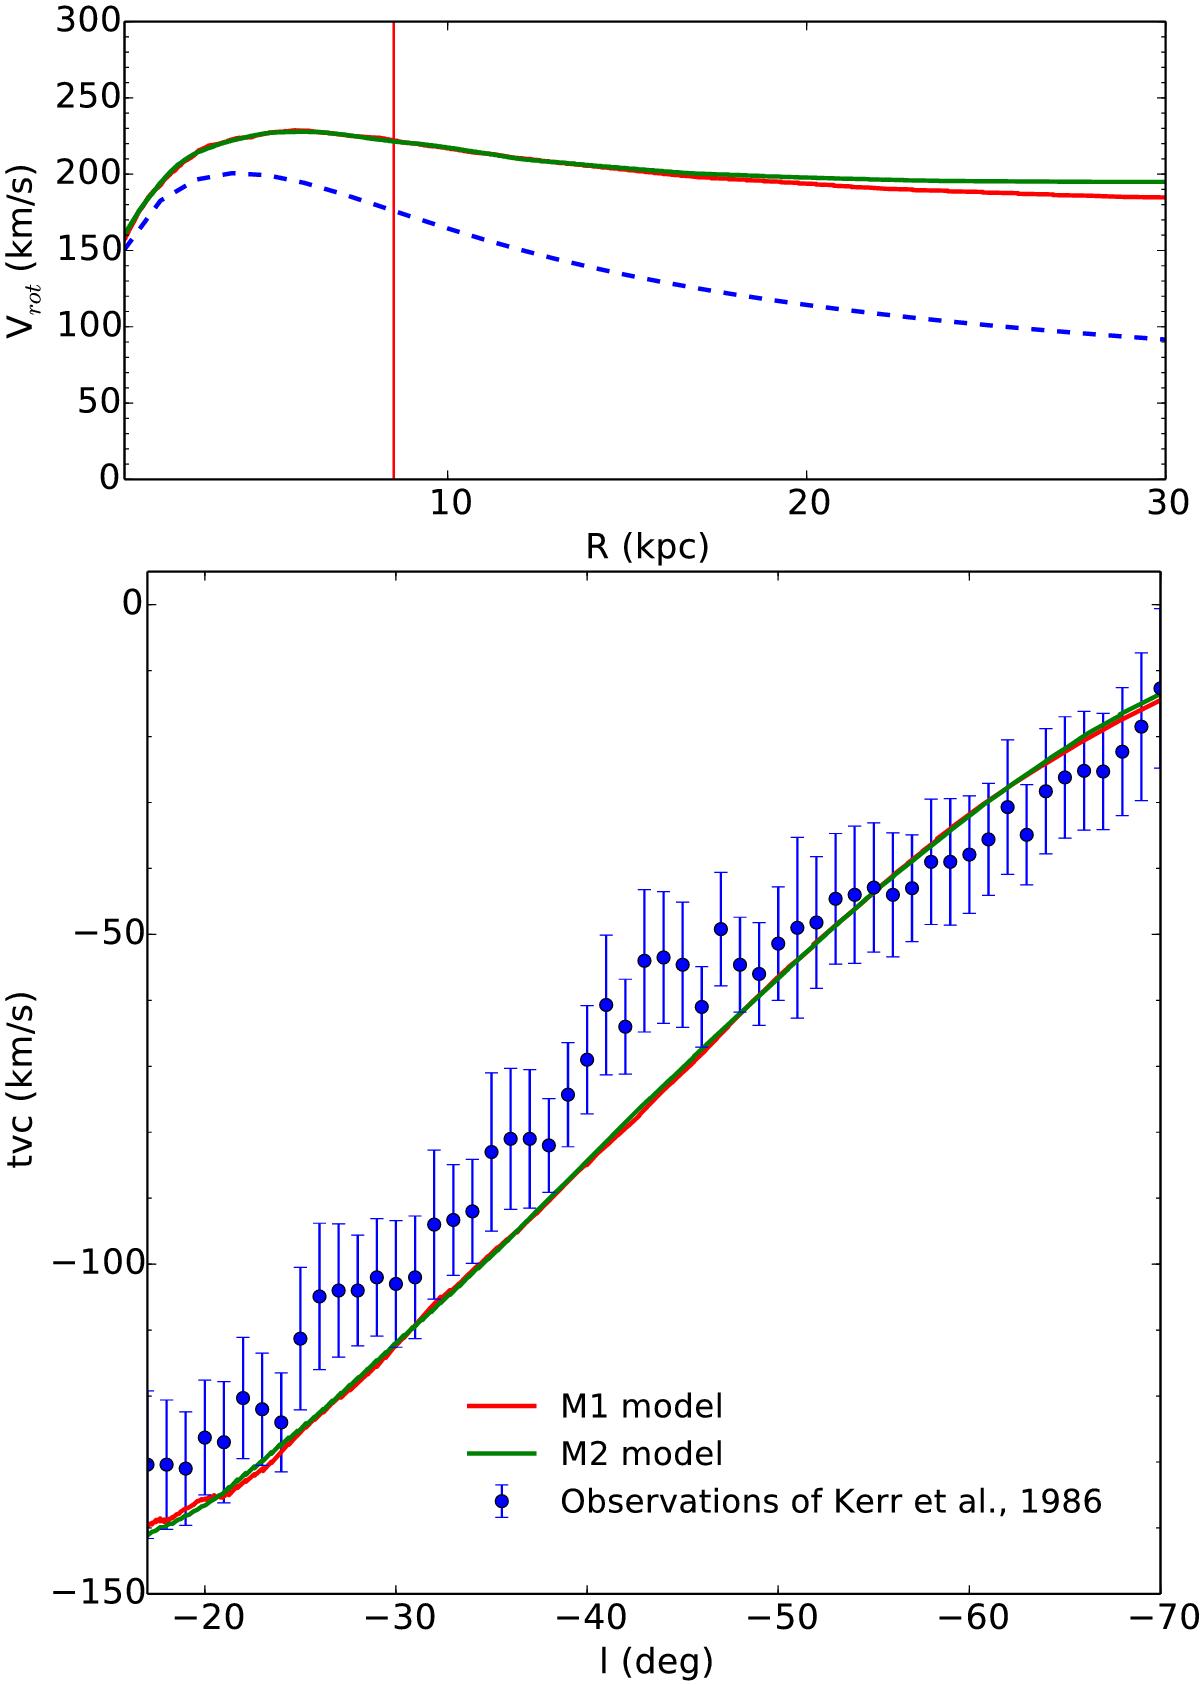
Top: rotation curves of our models of the MW in MOND along the GC – Sun axis. The M1 model rotation curve is in red, and the M2 model in green. The difference is clearly very mild. The dashed blue line represents the Newtonian rotation curve without DM and without a hot corona. We fixed the Sun at 8.5 kpc from the GC illustrated by the vertical red line on this figure. Bottom: reproduction of Fig. 2 of Famaey & Binney (2005) for the terminal velocity curve of the M1 and M2 models in the inner Galaxy (fourth quadrant), together with the data of Kerr et al. (1986). The model is not a perfect representation of the inner Milky Way, but small changes of the inner baryonic structure within the solar radius do not matter much for the Sgr stream.
Current usage metrics show cumulative count of Article Views (full-text article views including HTML views, PDF and ePub downloads, according to the available data) and Abstracts Views on Vision4Press platform.
Data correspond to usage on the plateform after 2015. The current usage metrics is available 48-96 hours after online publication and is updated daily on week days.
Initial download of the metrics may take a while.