Free Access
Fig. 4
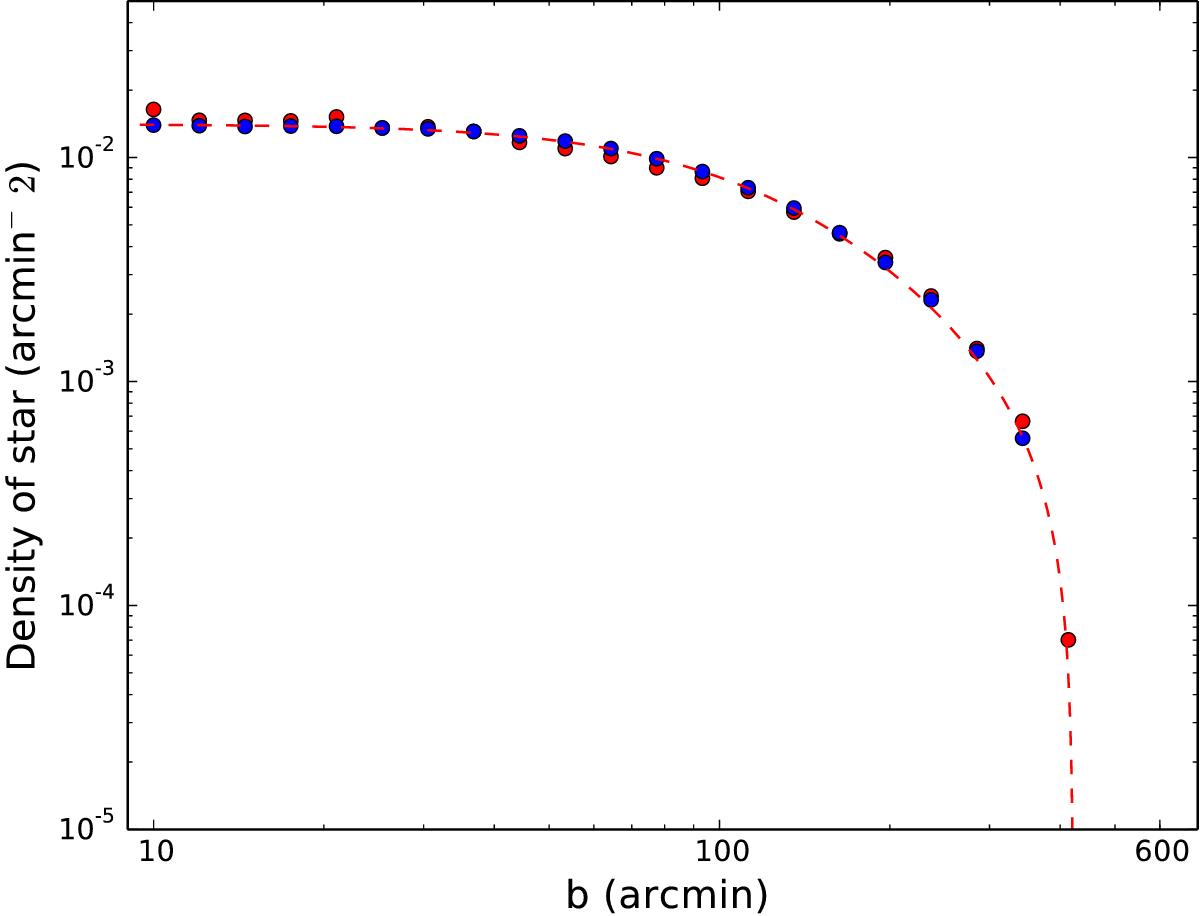
Stellar density along the minor axis of the Sgr dSph, of observed M-giant stars from the 2MASS survey (in red), and of the particles from the MOND disk model M1 simulation after 4 Gyr of integration (in blue). The red dashed line represents the best fit of a King profile to the observed M-giants.
Current usage metrics show cumulative count of Article Views (full-text article views including HTML views, PDF and ePub downloads, according to the available data) and Abstracts Views on Vision4Press platform.
Data correspond to usage on the plateform after 2015. The current usage metrics is available 48-96 hours after online publication and is updated daily on week days.
Initial download of the metrics may take a while.