Fig. 1
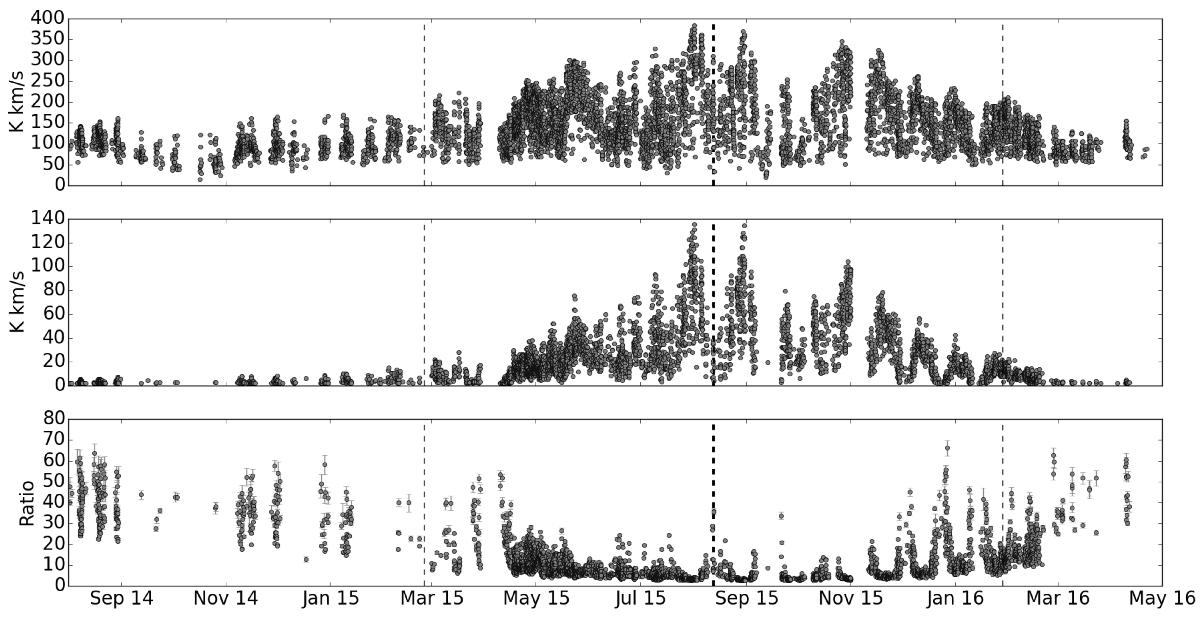
Time evolution of the line area of H![]() O (top panel), H
O (top panel), H![]() O (middle panel), and the H
O (middle panel), and the H![]() O/H
O/H![]() O line area ratio (bottom panel) from August 2014 to April 2016. The thick dashed line represents perihelion, which occurred on August 13, 2015, and the thin dashed lines represent when 67P was 1 AU from closest approach, pre- and post-perihelion.
O line area ratio (bottom panel) from August 2014 to April 2016. The thick dashed line represents perihelion, which occurred on August 13, 2015, and the thin dashed lines represent when 67P was 1 AU from closest approach, pre- and post-perihelion.
Current usage metrics show cumulative count of Article Views (full-text article views including HTML views, PDF and ePub downloads, according to the available data) and Abstracts Views on Vision4Press platform.
Data correspond to usage on the plateform after 2015. The current usage metrics is available 48-96 hours after online publication and is updated daily on week days.
Initial download of the metrics may take a while.