Fig. 7
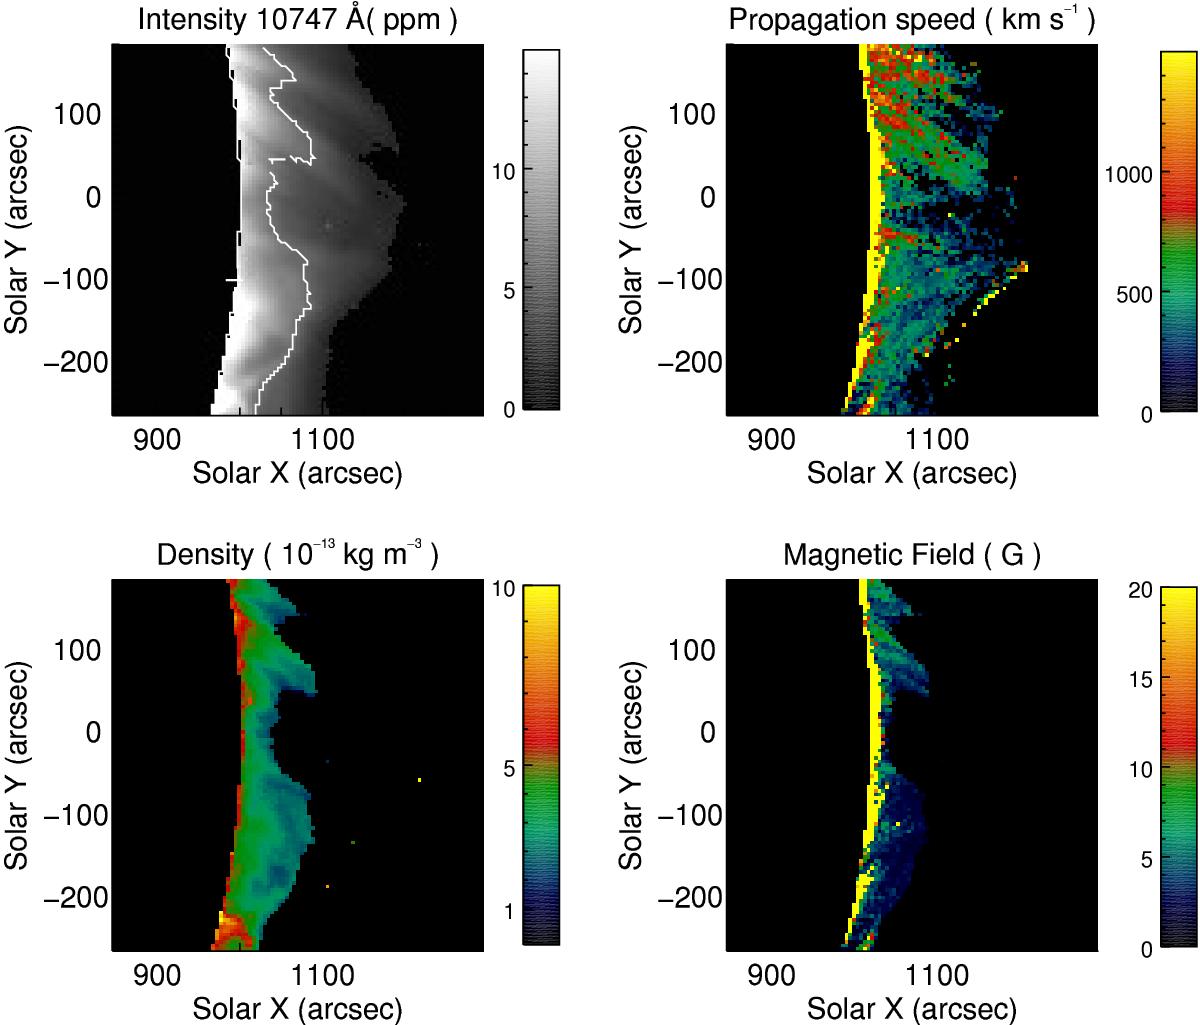
The results of the magneto-seismology of propagating transverse waves. The top left panel shows the coronal loop as observed in 10 747 Å line centroid wavelength at 18:43 UT, with the measured propagation speeds of the transverse waves shown in the top right panel. The white contour over the intensity image shows the region in 10 798 Å that has adequate signal level. The lower left panel displays the estimates of plasma density from the 10 798 Å/10 747 Å ratio and the right hand panel shows the magnetic field estimate.
Current usage metrics show cumulative count of Article Views (full-text article views including HTML views, PDF and ePub downloads, according to the available data) and Abstracts Views on Vision4Press platform.
Data correspond to usage on the plateform after 2015. The current usage metrics is available 48-96 hours after online publication and is updated daily on week days.
Initial download of the metrics may take a while.