Fig. 3
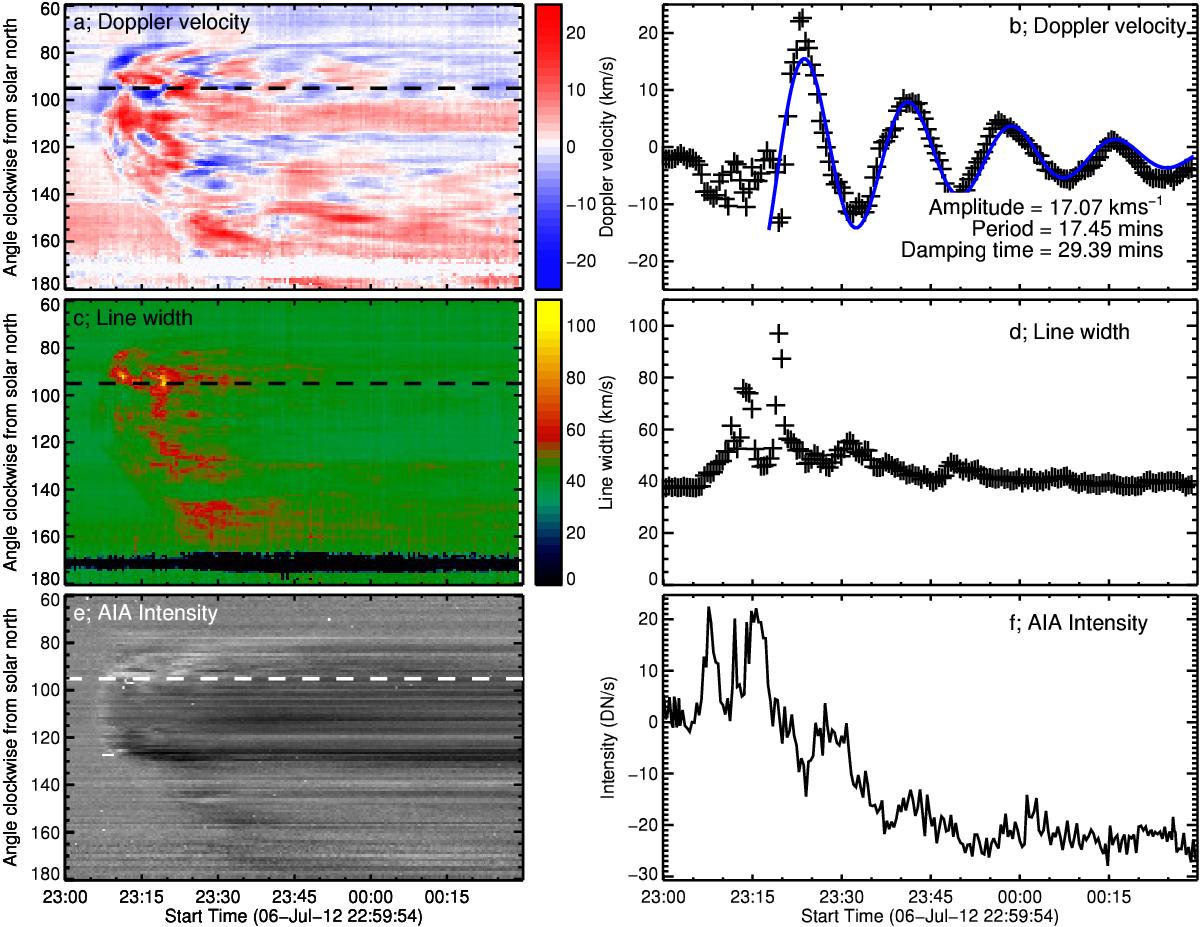
Temporal variation in CoMP Doppler velocity (panel a)) and line width (panel c)) and AIA 193 Å percentage base difference (PBD) intensity (panel e)) at a height of 1.09 R⊙ (shown by the dashed line in panels a) and b) of Fig. 1). Panels b), d) and f) show the temporal variation in Doppler velocity, line width and AIA PBD intensity along the dashed line indicated in panels a), c) and e). The oscillatory behaviour of the loop system is very clear in the Doppler motion (panels a) and b)), indicating motion to-and-from the observer, while the impact of the pulse and subsequent evacuation of plasma into the CME is apparent in the line width (panels c) and d)) and plane-of-sky AIA observations respectively (panels e) and f)), as described in the text. The solid blue line in panel b) indicates a fit to the data using the damped cosine model described in Eq. (1).
Current usage metrics show cumulative count of Article Views (full-text article views including HTML views, PDF and ePub downloads, according to the available data) and Abstracts Views on Vision4Press platform.
Data correspond to usage on the plateform after 2015. The current usage metrics is available 48-96 hours after online publication and is updated daily on week days.
Initial download of the metrics may take a while.