Fig. 2
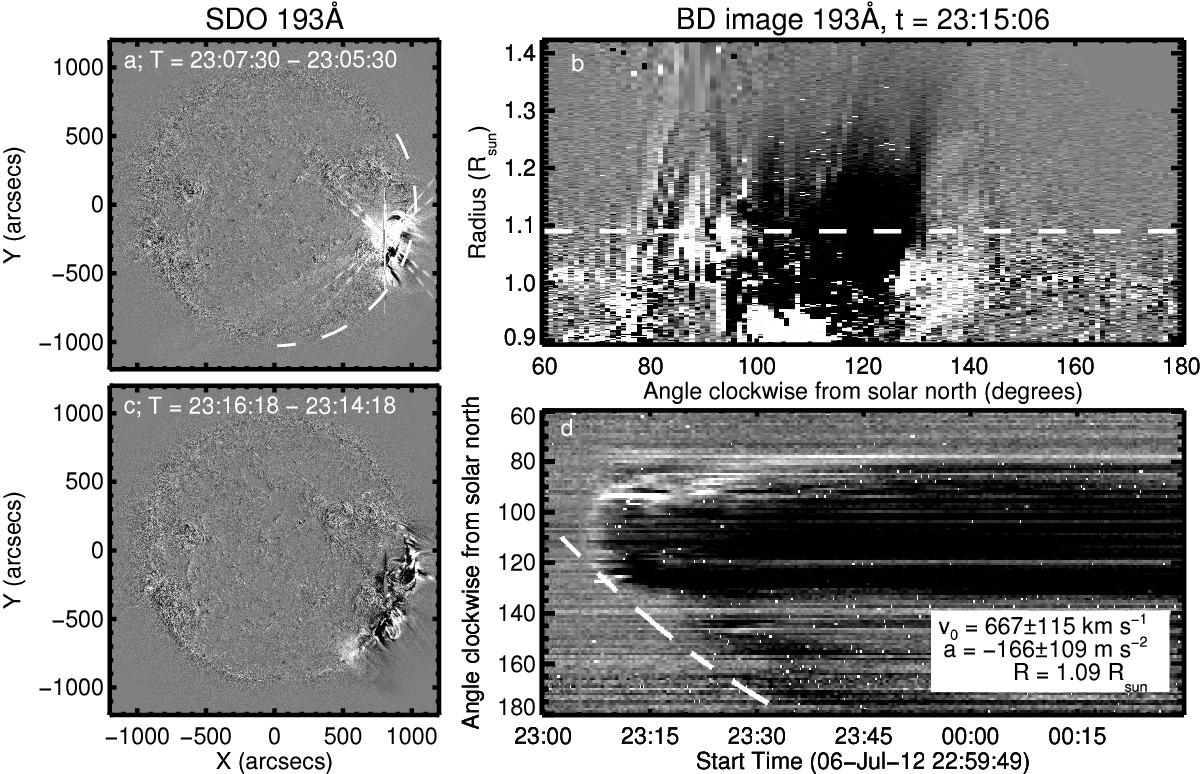
Running difference images from the 193 Å passband of the eruption (panel a)) and the evolution of the wave (panel c)). The temporal evolution of the wave is shown in the right panel of the movie available online (showing the west half of the solar disk only). Panel b) shows a base-difference deprojected annulus image showing the eruption at 23:15:06 UT, with the vertical axis giving the height from Sun-centre and the horizontal axis giving the position angle clockwise from solar north (indicated by the dashed white line in panel a)). Panel d) shows a base-difference image of the temporal variation at a height of 1.09 R⊙ (indicated by the white dashed line in panel b)). The dashed white line in panel d) shows the fit to the leading edge of the propagating pulse.
Current usage metrics show cumulative count of Article Views (full-text article views including HTML views, PDF and ePub downloads, according to the available data) and Abstracts Views on Vision4Press platform.
Data correspond to usage on the plateform after 2015. The current usage metrics is available 48-96 hours after online publication and is updated daily on week days.
Initial download of the metrics may take a while.