Fig. 1
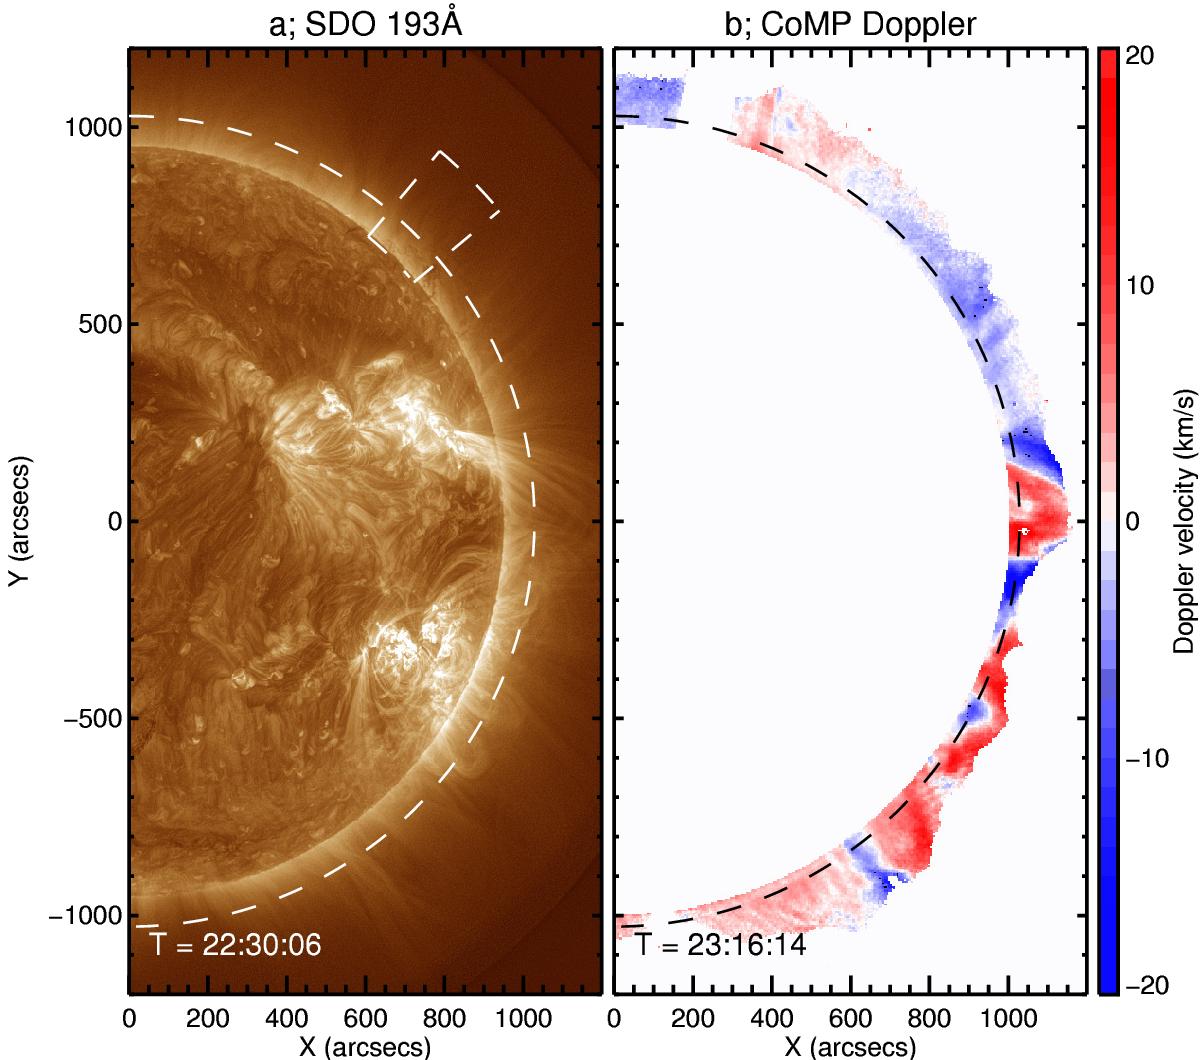
Intensity image from SDO 193 Å (panel a)) and Doppler velocity from CoMP (panel b)). The dashed lines above the limb (at a height 1.09 R⊙) in both panels are used to make Fig. 3. The arc sector in the top right of panel a) shows the region used to get the density of the quiet Sun in Sect. 5.1. Note that the intensity image in panel a) has been enhanced using the Multi-scale Gaussian Normalisation technique of Morgan & Druckmüller (2014). The evolution of the 193 Å channel is shown in the left panel of the movie available online.
Current usage metrics show cumulative count of Article Views (full-text article views including HTML views, PDF and ePub downloads, according to the available data) and Abstracts Views on Vision4Press platform.
Data correspond to usage on the plateform after 2015. The current usage metrics is available 48-96 hours after online publication and is updated daily on week days.
Initial download of the metrics may take a while.