Fig. 1
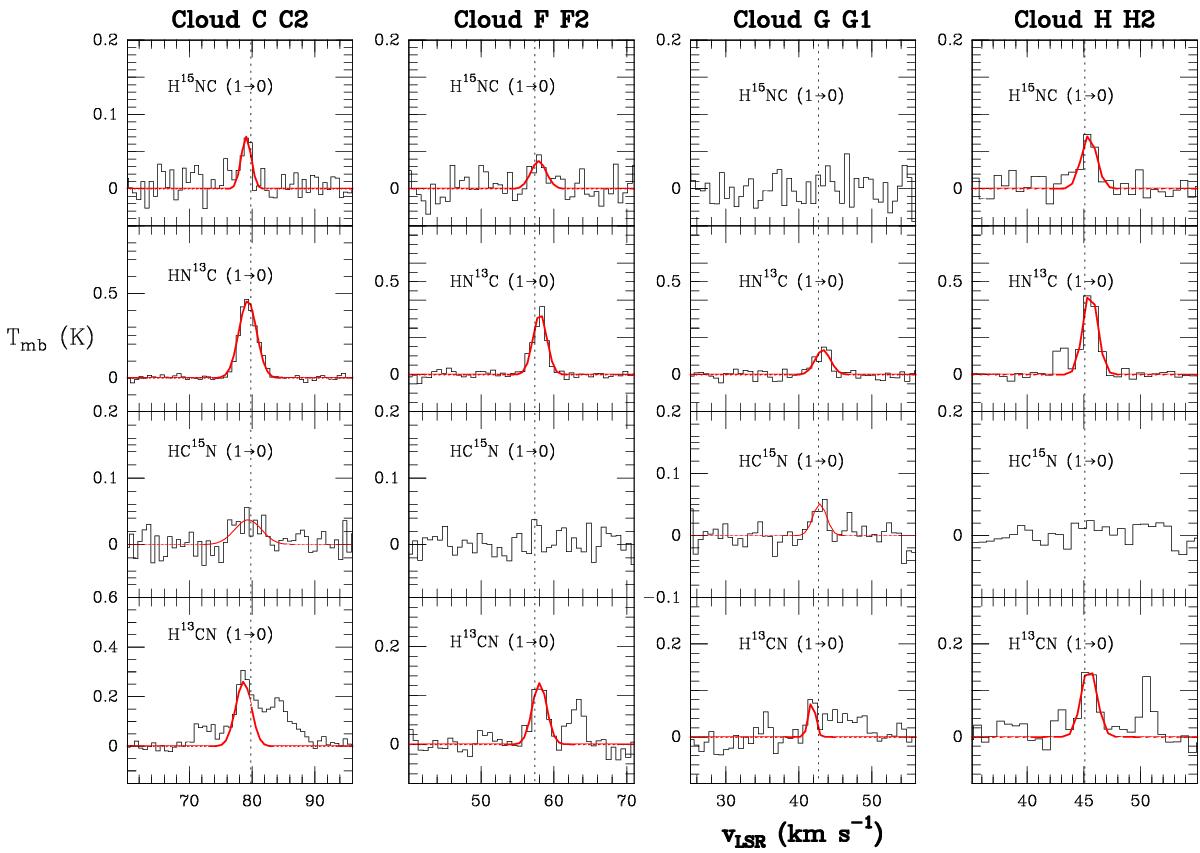
From left to right, top to bottom panels: emission lines of H15NC, HN13C, HC15N, and hyperfine transitions of H13CN observed with IRAM 30 m towards IRDCs C, F, G, and H. Red lines indicate the best Gaussian fit to the lines. The hyperfine components of H13CN were initially fitted but given the bad results of the fit; in a second step only the main F = 2 → 1 component of H13CN was fitted using a single-Gaussian component profile (see red line in bottom panels and Sect. 3.1 for details). See also Figs. A.1−A.4 for all spectra taken.
Current usage metrics show cumulative count of Article Views (full-text article views including HTML views, PDF and ePub downloads, according to the available data) and Abstracts Views on Vision4Press platform.
Data correspond to usage on the plateform after 2015. The current usage metrics is available 48-96 hours after online publication and is updated daily on week days.
Initial download of the metrics may take a while.