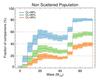
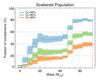
Fig. 9
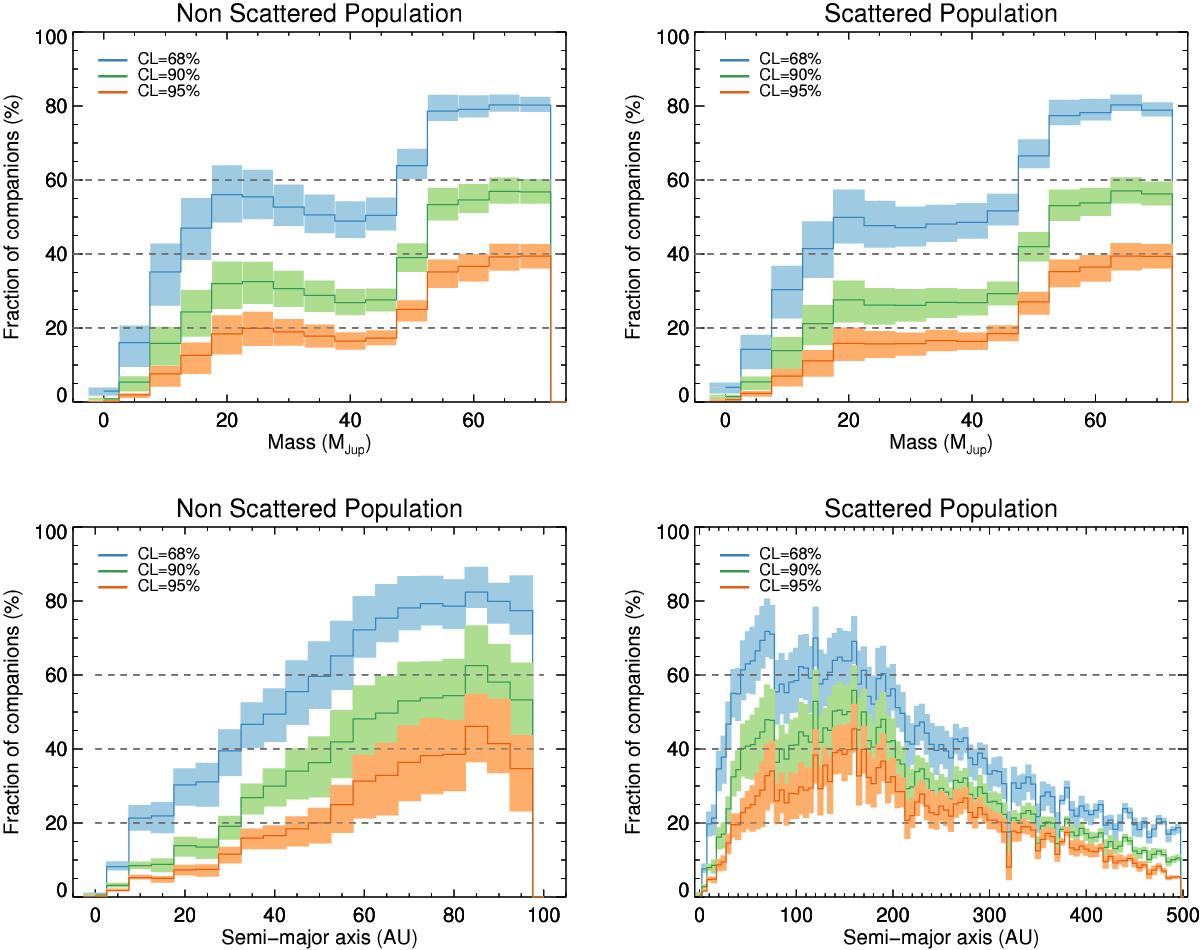
Histogram of the mass and separation of companions detectable at various confidence levels, for the scattered (right panels) and non-scattered (left panels) population. Similarly to Fig. 7, the plain lines represent the values for the best age estimate of the stars, and the colored envelopes show the variations observed when considering the minimum and maximum ages. The fraction of detected companions is smaller for the maximum ages and larger for the minimum ages. For the histograms in mass, semi-major axes from 1 to 500 AU are considered, and for the histograms in semi-major axis, masses from 1 to 75 MJup are considered. A confidence level of 95% means that for a given bin, the height of the bin represents the fraction of companions in that bin that have been detected in 95% (or more) of the simulated surveys. The small drop at 330 AU in the scattered population is numerical.
Current usage metrics show cumulative count of Article Views (full-text article views including HTML views, PDF and ePub downloads, according to the available data) and Abstracts Views on Vision4Press platform.
Data correspond to usage on the plateform after 2015. The current usage metrics is available 48-96 hours after online publication and is updated daily on week days.
Initial download of the metrics may take a while.