Fig. 8
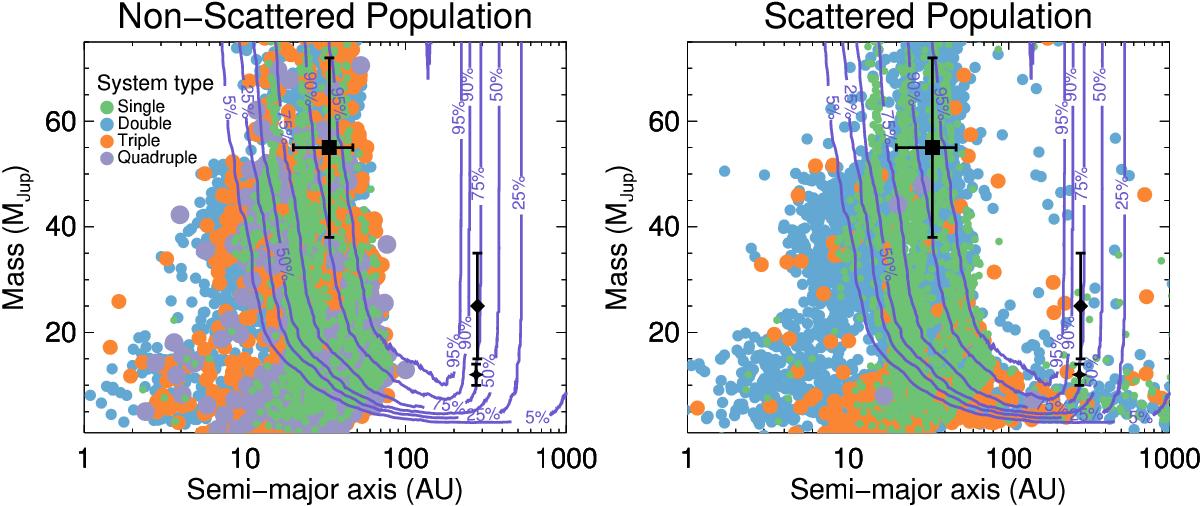
Comparison of the non-scattered (left) and scattered (right) GI populations (Forgan & Rice 2013; Forgan et al. 2015) with the mean detection probabilities of the observations (best age estimate). A significant fraction of the GI population could potentially be detected, even in the non-scattered case. The colors and symbols for the populations and the known companions are the same as in Figs. 3 and 6.
Current usage metrics show cumulative count of Article Views (full-text article views including HTML views, PDF and ePub downloads, according to the available data) and Abstracts Views on Vision4Press platform.
Data correspond to usage on the plateform after 2015. The current usage metrics is available 48-96 hours after online publication and is updated daily on week days.
Initial download of the metrics may take a while.