Fig. 10
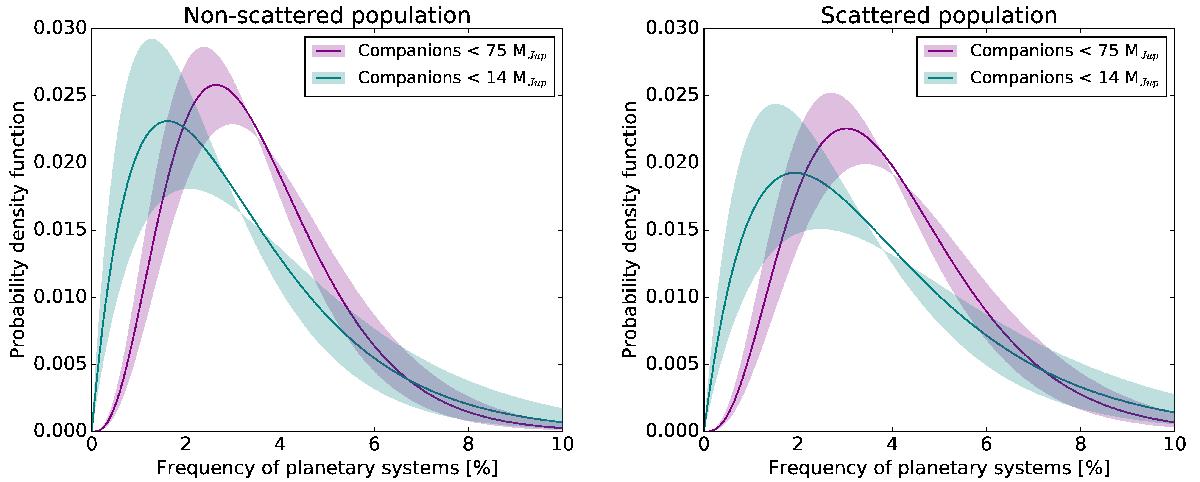
Probability distribution of the frequency of stars hosting at least one planetary system, based on the non-scattered (left) and scattered (right) populations described in Sect. 5. Similarly to Figs. 7 and 9, the plain lines represent the probability density function obtained when considering the best age estimate, and the shaded areas show the variations obtained when considering the full age range. The results are summarized in Table 3.
Current usage metrics show cumulative count of Article Views (full-text article views including HTML views, PDF and ePub downloads, according to the available data) and Abstracts Views on Vision4Press platform.
Data correspond to usage on the plateform after 2015. The current usage metrics is available 48-96 hours after online publication and is updated daily on week days.
Initial download of the metrics may take a while.